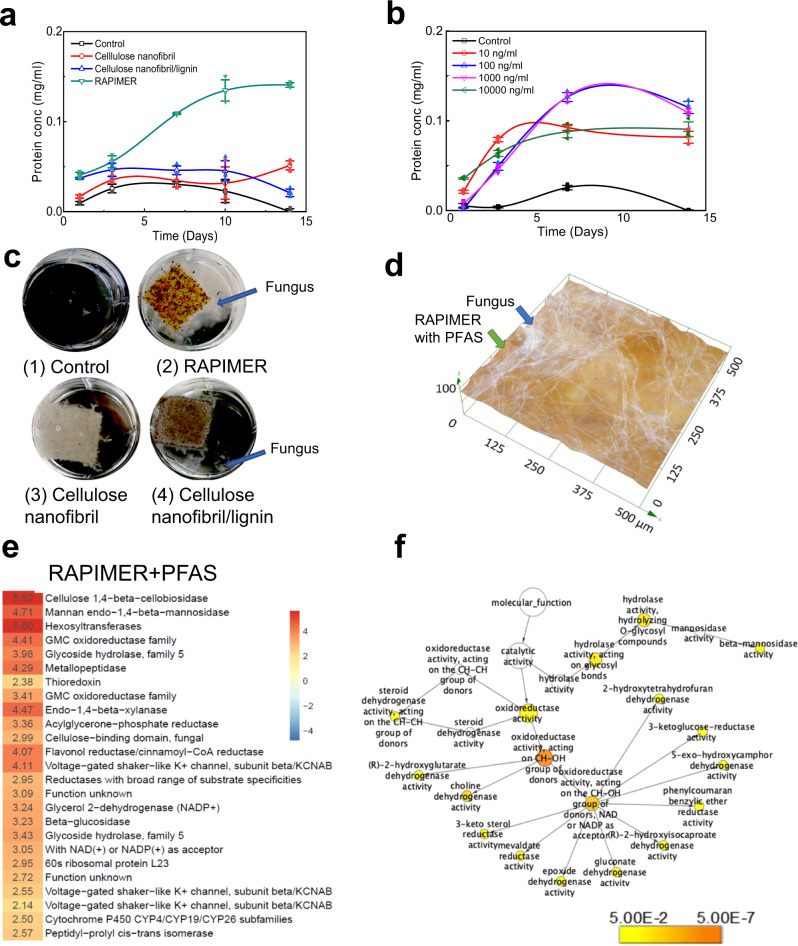
Fig. 5. The assessment of fungal degradation of RAPIMER integrated system.
a The fungal growth curve on different bioinspired composites. Top green line: RAPIMER composite, blue line: cellulose nanofibril/lignin composite, red line: cellulose nanofibril, black line: glucose deprived Kirk media as the control. b The fungal growth curve on RAPIMER composite treated with solutions in different PFAS concentrations. The blue line: 100 µg/L. The purple line: 1000 µg/L. The green line: 10,000 µg/L. The red line: 10 µg/L. The black line: Kirk media as the control. All PFAS solution is the mixture of PFOA/PFOS (1:1). For a and b, the experiment was reproduced n = 3 times. The mean with error bar represents the average value and standard deviation (SD) of experimental replicates. c The microscope images of fungal growth on different materials. (1) Glucose-derived Kirk media, (2) RAPIMER composite, (3) Cellulose nanofibril composite, (4) cellulose nanofibril/lignin composite. The background is adjusted into black to show the fungus mycelia. d The digital microscopy image of I. lacteus hyphae growing on the RAPIMER substrate adsorbed with PFAS. e The RAPIMER-induced overexpressed enzymes upon PFAS treatment. The numbers denoted the normalized spectra counts for the proteins in the heat map. f The GO enriched pathway analysis of upregulated proteins in the PFAS treatment conditions.

