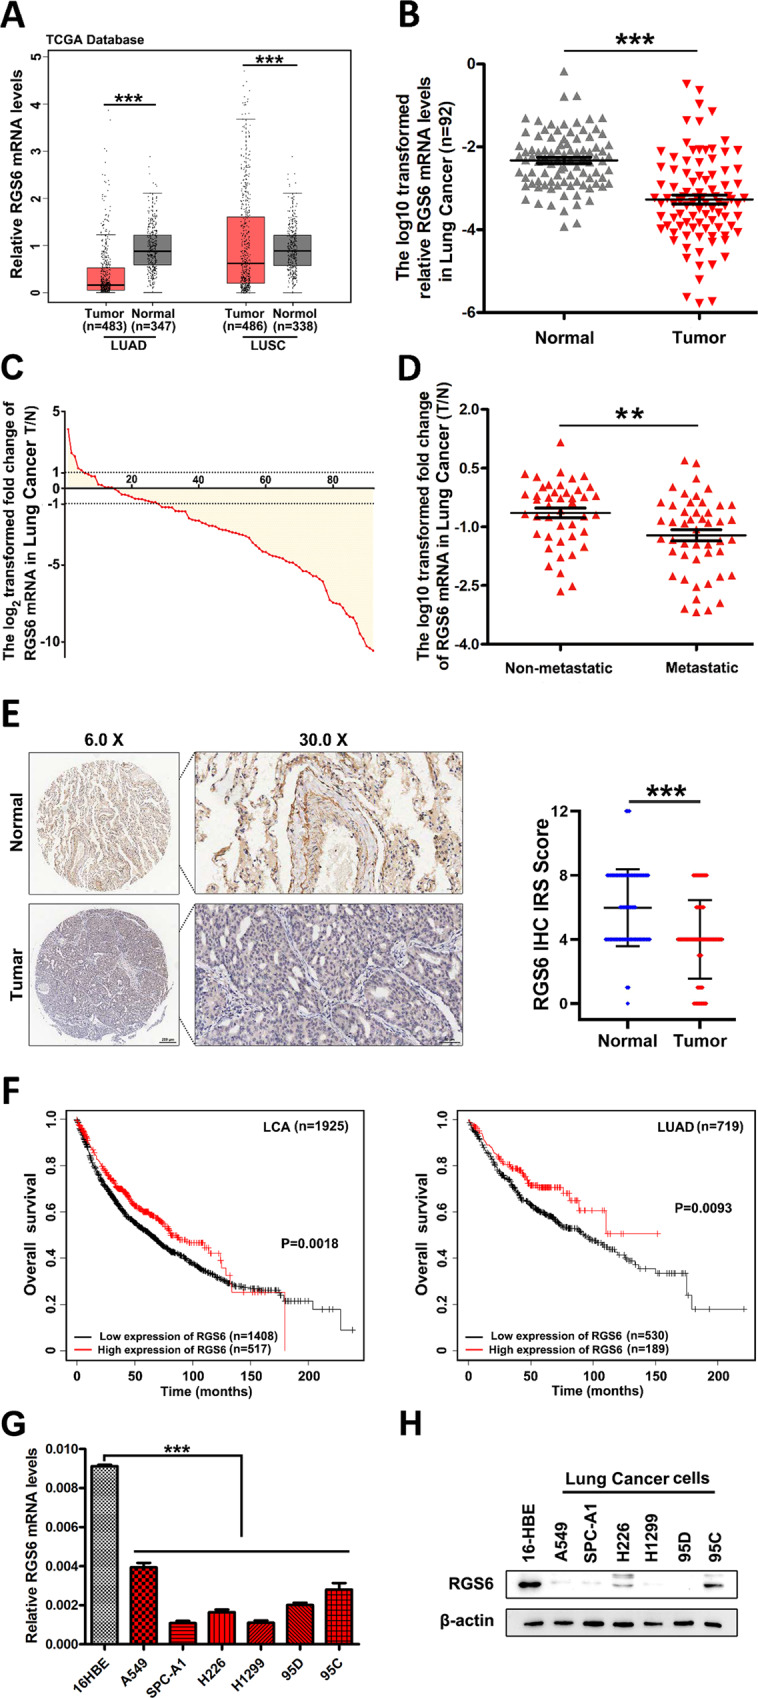
Fig. 1. RGS6 expression is downregulated in human NSCLC tissues.

A RGS6 mRNA expression in cancer tissues compared with the non-cancer counterparts from the LUAD and LUSC patients from TCGA. LUAD, lung adenocarcinoma; LUSC, lung squamous cell carcinoma (***p < 0.001). B qRT-PCR analysis of RGS6 mRNA levels in 92 human lung cancer tissues and paired noncancerous lung tissues. Mean values are indicted by solid bars, and values are expressed as mean ± SEM. T, tumor tissues; N, paired noncancerous lung tissues. C Relative expression of RGS6 mRNA in 92 paired lung cancer tissues. Y-axis represents the log2 transformed fold change of T/N expression ratios of RGS6 mRNA. The number of each specimen is shown below X-axis. D Relative expression (T/N) of RGS6 in non-metastatic (n = 44) and metastatic (n = 48) lung cancer tissues. Non-metastatic tissues were from lung cancer patients without any metastasis and metastatic tissues were from lung cancer patients with lymph node metastasis or distant metastasis (**p < 0.01). E RGS6 protein levels in lung cancer tissues and paired adjacent normal tissues were examined by IHC in tissues from 75 lung cancer patients. Left panel, representative IHC images. Right panel, RGS6 protein levels in tumor and normal tissues were quantified and shown as the IHC immunoreactivity score (IRS) (***p < 0.001). F Correlation between low RGS6 expression level and poor prognosis in lung cancer patients. LCA, lung carcinoma. Kaplan–Meier plots were generated using Kaplan–Meier Plotter (http://www.kmplot.com) (**p < 0.01). G RGS6 mRNA levels, H RGS6 protein levels in human lung epithelial cells (16-HBE) and six NSCLC cell lines (five adenocarcinoma cell lines: A549, SPC-A1, H1299, 95D and 95 C; as well as one squamous cell carcinoma cell line: H226). Each experiment was performed in triplicates (***p < 0.001).
