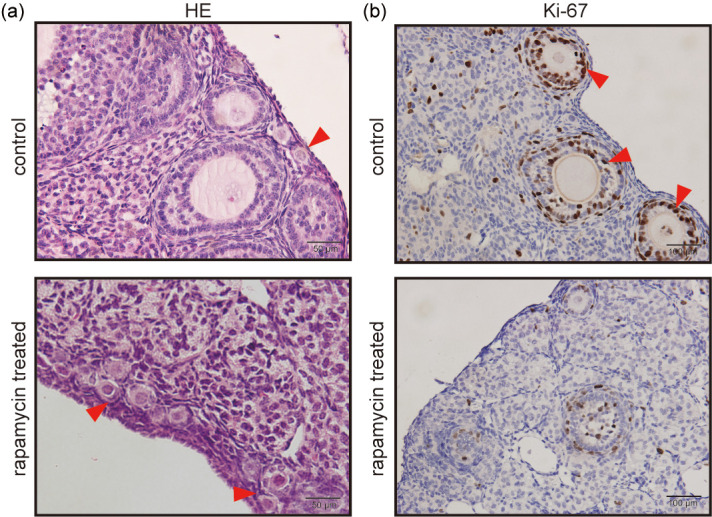
Fig. 2.

Representative images for HE staining and Ki-67 expression in mouse ovaries treated with rapamycin at 5 mg/kg for 30 days. (a) HE staining shows that primordial follicles are aggregated and reserved more in the rapamycin-treated group. Red arrows indicate primordial follicles. Scale bar = 50 μm. (b) Immunohistochemical analysis of Ki-67 shows a decrease in the number of developing follicles in the rapamycin group. Red arrows indicate Ki-67 positive cells. Scale bar = 100 μm. HE, hematoxylin and eosin.
