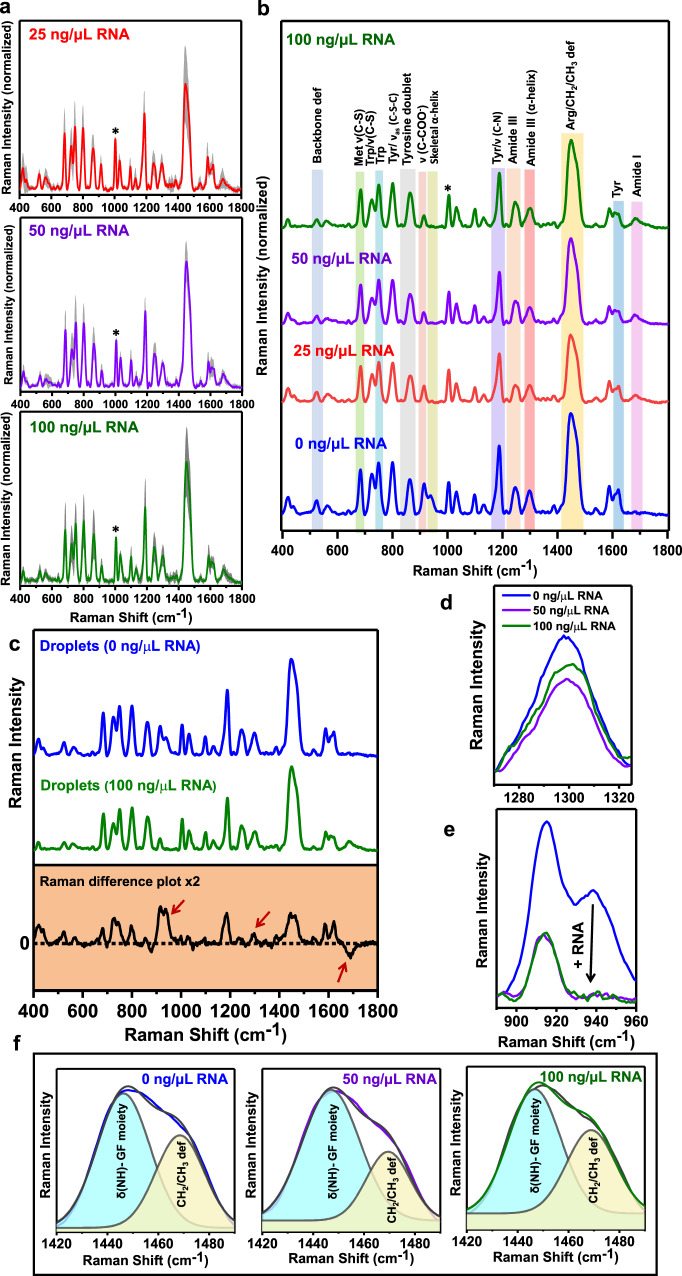
Fig. 6. Single-droplet SERS in the presence of RNA.
a Average single-droplet SERS spectra in the presence of 25 ng/μL, 50 ng/μL, and 100 ng/μL polyU RNA (spectra recorded at 5 mW laser power with a ×50 objective; number of droplets, n = 7). Solid lines represent mean, whereas shaded region represents the standard deviation (n = 7). All spectra are normalized with respect to the phenylalanine ring breathing band at 1003 cm−1 marked by an asterisk. b Stacked average single-droplet SERS spectra for different concentrations of RNA are shown in blue (0 ng/μL RNA), red (25 ng/μL RNA), purple (50 ng/μL RNA), and olive (100 ng/μL RNA) for comparison. c Raman difference plot (between 0 ng/ μL RNA and 100 ng/ μL RNA) of single-droplet SERS spectra of droplets in the absence and presence of RNA (100 ng/μL). An arrow at 1682 cm−1 represents the emergence of amide I at higher RNA concentrations and arrows at 940 cm−1 and 1300 cm−1 represents greater α-helical content within droplets in the absence of RNA. d Zoomed in Amide III region for FUS droplets in the absence and presence of RNA (50 ng/μL, 100 ng/μL). e Skeletal C–C stretching mode of α-helical structures at 940 cm−1 that disappears at higher RNA concentrations. f Gaussian deconvolution of the region 1420−1490 cm−1. The black line represents the actual data while the colored lines represent the cumulative fit. Cyan region represents the N–H deformations of the guanidinium fragment (GF) of arginine residues, while the light-yellow region represents the CH2/CH3 deformations. See Supplementary Table 2 for percentage analysis. See “Methods” for details of data acquisition, processing, and analysis.

