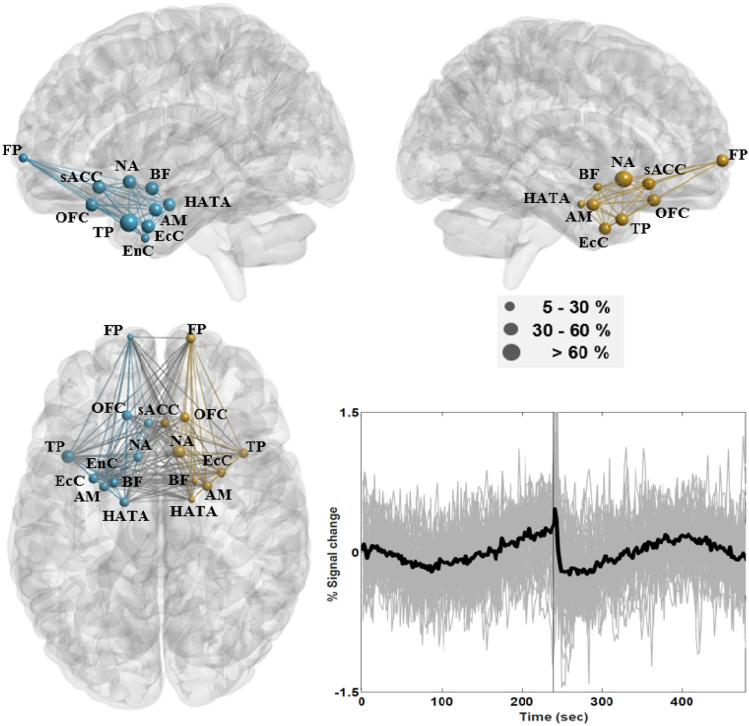
Fig. 5.
Connectivity of the stress-response network (SRN), which engaged the amygdala (AM), nucleus accumbens (NA), basal forebrain (BF), left entorhinal cortex (EnC), ectorhinal cortex (EcC), frontal pole (FP), orbito-frontal cortex (OFC), subgenual anterior cingulate cortex (sACC), temporal pole (TP), and Area HATA in the hippocampus. The nodal areas in the left hemisphere are indicated in blue, and those in the right hemisphere are indicated in gold. The diameter of the ball indicates the proportion of supra-threshold voxels in a given area of the network. The chart in the lower right panel depicts subject-level time courses in grey across supra-threshold voxels in SRN areas with the group-level mean time course indicated in bold (Color figure online)

