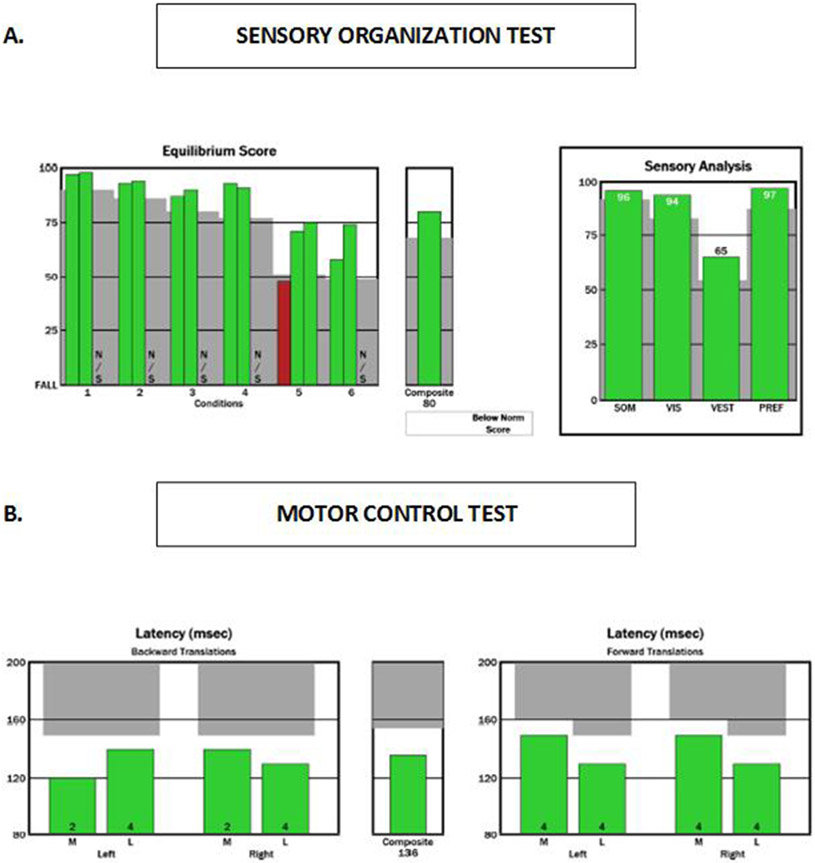
Figure 1. NeuroCom report showing pre-test (baseline) results on the SOT (Figure 1A) and MCT (Figure 1B).
Green bars on all plots indicate results within normal limits for this patient’s age group. NS means that particular test condition was not completed. In the SOT the patient stands quietly for 20 seconds each trial under the following six conditions: (1) eyes open, no sway reference; (2) eyes closed, no sway reference; (3) eyes open, visual/surround sway reference; (4) eyes open, support surface sway reference; (5) eyes closed, support surface sway reference; and (6) eyes open, support surface and visual/surround sway reference. Sway reference is the displacement of the platform and/or the visual surround. Higher scores reflect less body sway (i.e., better balance).The top left plot reflects the patient’s performance on each trial per condition. The top right plot reflects the patient’s performance on the somatosensory (SOM), vestibular (VES), visual (VIS) and preference (PREF) ratios. Which are calculated using the average equilibrium score for each condition. In the MCT (lower plot) the patient is required to stand still and keep a straight posture in response to anterior and posterior perturbations of the forceplate surface. The average amplitude of latency response (in milliseconds) between the shift of the forceplate and the torque generated by the individual on the forceplate. Responses are measured for each foot for medium and large perturbations in the forward and backward directions.

