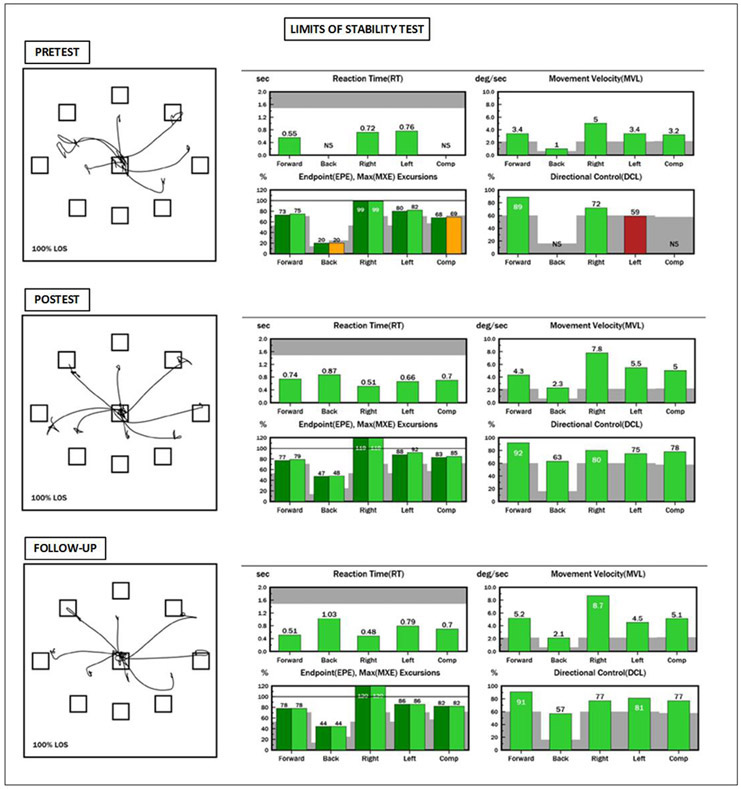
Figure 2. NeuroCom report showing pre-test (baseline), post-test (post intervention) and follow-up results on the LOS test.
In this test the patient is required to purposefully shift their weight toward targets in eight directions while receiving continuous visual feedback about the movement of their COG. These targets represent 100% of their theoretical limits of stability based upon their height. During the leaning task, the patient must maintain a straight posture, only moving at their ankles, like an inverted pendulum. The top left star-shaped tracing of each testing time point represents the trajectory of the patient’s center of gravity. To the right of that are the scores for each variable and each direction. Green bars indicate normal results and yellow or red bars indicate abnormal results. Gray represents the area where results are more than 2 standard deviations away from the normative mean. NS means not scored and it was generated because the patient was not able to perform the leaning task on that particular direction. Note the important increase on backwards excursion at post intervention compared to baseline, and maintenance of scores within normal limits at follow-up

