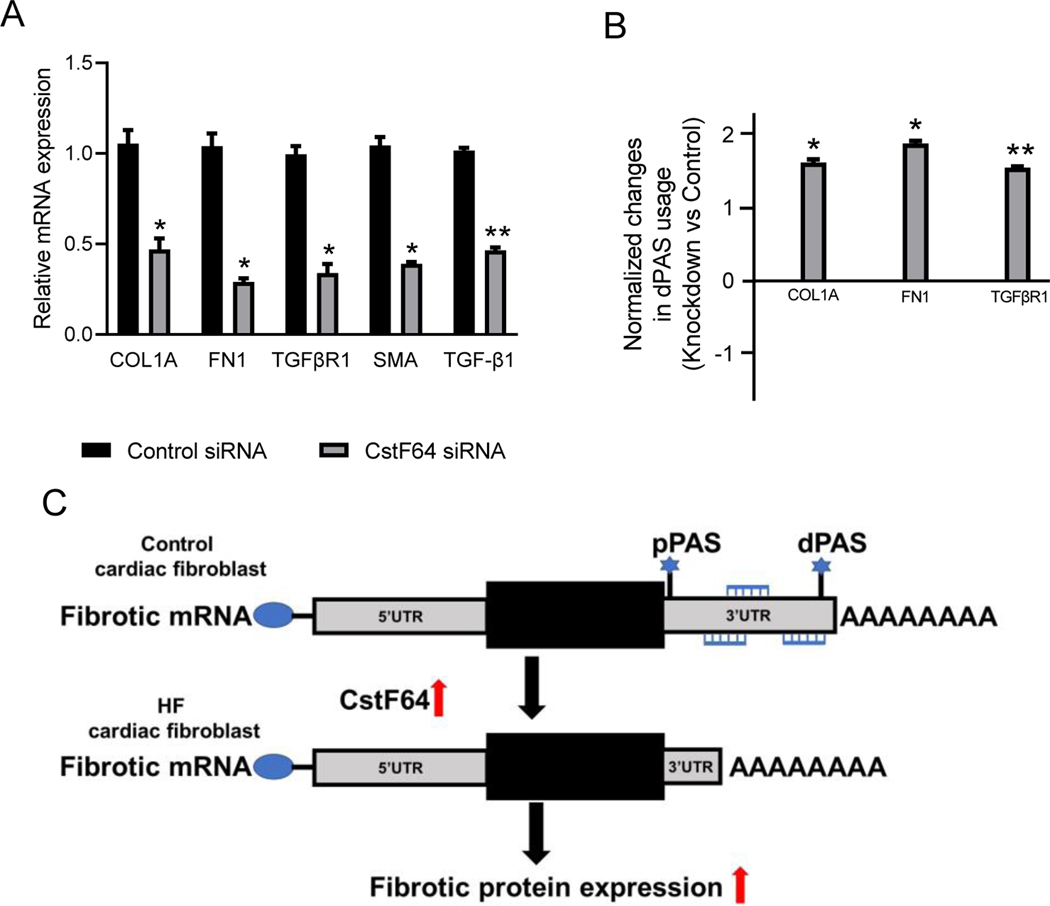
Figure 4. CstF64 knockdown promotes the 3’UTR lengthening of profibrotic genes expression in HF fibroblasts.
(A) Bar plot showing relative mRNA expression of COL1A, FN1, TGRβR1, TGF-β1, and α-SMA in an HF fibroblast 72 hours post-transfection with CstF64 and control siRNA by RT-qPCR. (B) Plot showing significant lengthening of COL1A, FN1, and TGFβR1 in HF fibroblasts 72 hours post-transfection with CstF64 siRNA compared to control siRNA by dPAS using RT-qPCR. Data are represented as mean ± SEM. Student’s t-test was used to analyze the data; n = 3, * p < 0.05; ** p < 0.01. (C) The model illustrates the effect of CstF64 upregulation on cardiac fibrosis.

