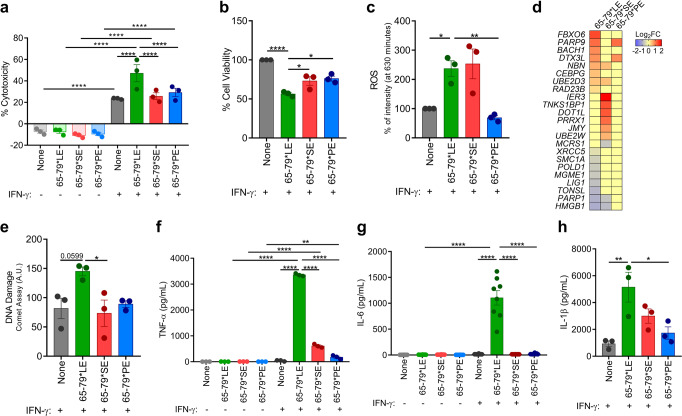
Fig. 4. Allele-specific activation of cell death, pro-inflammatory cytokine production and DNA damage by the LE.
a–c Cell death a, viability b, and ROS levels c, in THP-1 cells exposed to different allelic epitopes (n = 3). d Heatmap of DNA damage-related genes (Model B) in THP-1 cells exposed to different allelic epitopes (n = 4). e DNA damage, quantified by the comet assay, in THP-1 cells exposed to different allelic epitopes (n = 3). f–h Supernatant levels of the pro-inflammatory cytokines TNF-α f, IL-6 g, and IL-1β h, in THP-1 macrophages exposed to different allelic epitopes (n = 3). Data represent mean ± SEM. One-way (b, c, e, h), or two-way (a, f, g) ANOVA. *p < 0.05, **p < 0.01, ***p < 0.001, ****p < 0.0001. See also Supplementary Fig. 5.

