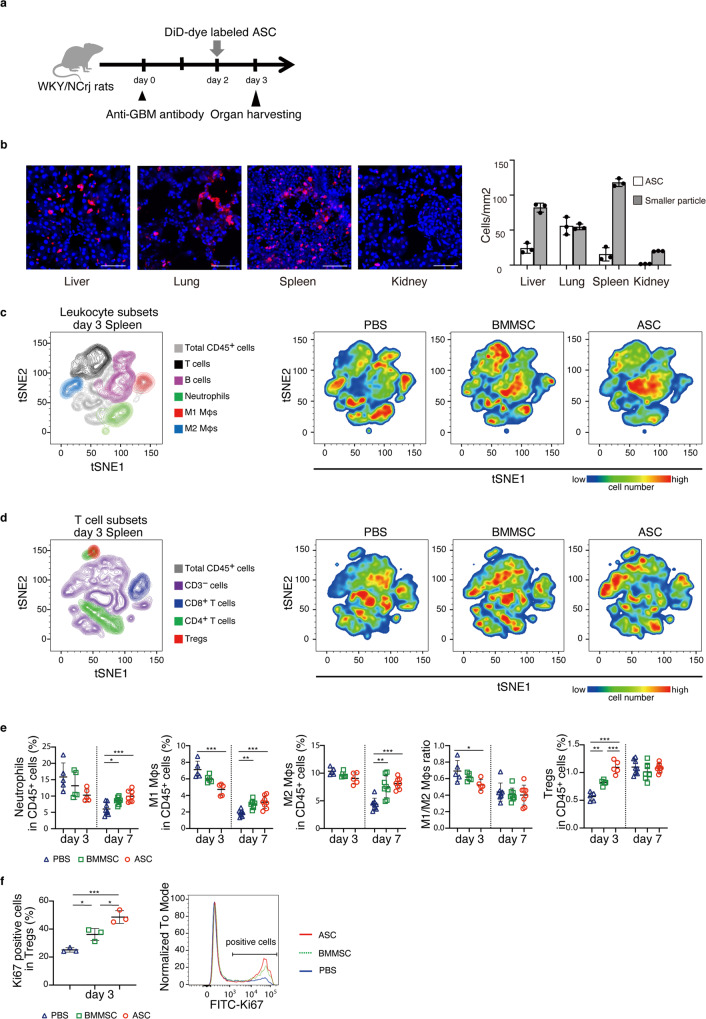
Fig. 3. Accumulated ASCs decreased M1 macrophages while increasing M2 macrophages and Tregs in the spleen.
a Experimental scheme for analyzing the distribution of administered ASCs in the body. DiD-dye labeled ASCs were administered to nephritis-induced WKY/NCrj rats on day 2. Tissues were harvested on day 3. b The number of DiD-positive cells with large DiD-dye particles and small DiD-dye particles in the liver, lung, spleen, and kidney is shown (n = 3 per group). Scale bars, 100 μm. c, d T-distributed stochastic neighbor embedding (tSNE) implementation for flow cytometry data visualization of leukocyte and T-cell subsets. The data are presented as color-coded leukocyte population overlays (left) or cell number density color-coded (right) in the tSNE space. e Frequency of splenic leukocyte subsets in CD45+ cells analyzed by flow cytometry on days 3 and 7 (day 3, n = 5 per group; day 7, n = 8 per group). f The population of Ki67-positive cells in splenic Treg subset on day 3 (n = 3 per group). All data are shown as means ± SD. *p ≤ 0.05, **p ≤ 0.01, ***p ≤ 0.001 as determined by ANOVA.

