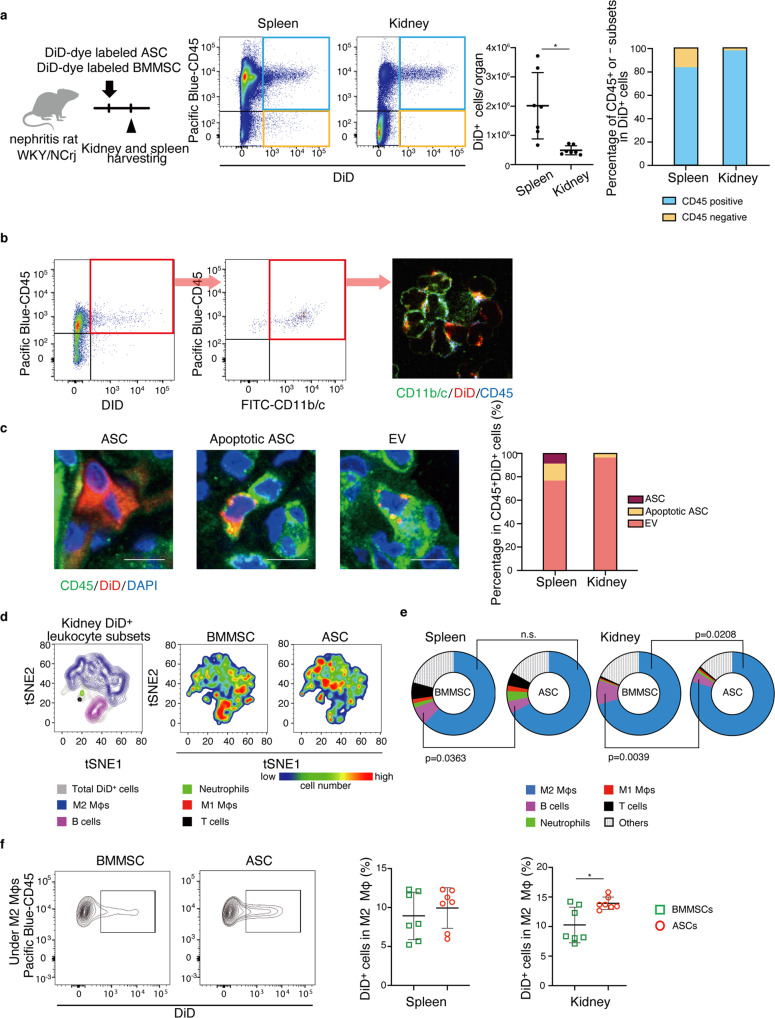
Fig. 5. EVs from administered ASCs were predominantly transferred to M2 macrophages.
a Experimental scheme for analyzing the organ and cellular distribution of MSC membrane components by flow cytometry. The spleen and kidney were analyzed one day after the DiD-dye labeled ASC administration. The left graph shows the percentage of CD45-positive or negative subsets in DiD+ cells. The right graph shows the number of DiD+ cells in the spleen and kidney (n = 7 per group). b The confocal micrograph of CD11b/c+DiD+ cells sorted by flow cytometry. DiD particles were localized on the leukocyte membrane. c Representative images of ASC, Apoptotic ASC, and EV. Scale bars, 10 μm. The right graph shows the frequency of three DiD+ populations in the spleen and kidney (n = 3 per group). d tSNE plot from the flow cytometry analysis shows DiD+ leukocyte subsets. e Pie charts show the proportion of each subset in DiD+ leukocytes in the spleen and kidney (n = 7 per group). f Representative images and results of flow cytometry analysis show DiD+ cell frequency in renal M2 macrophages after administration of DiD-dye labeled ASCs or BMMSCs into nephritis rats (n = 7). All data are shown as means ± SD. *p ≤ 0.05 as determined by Welch’s t test.

