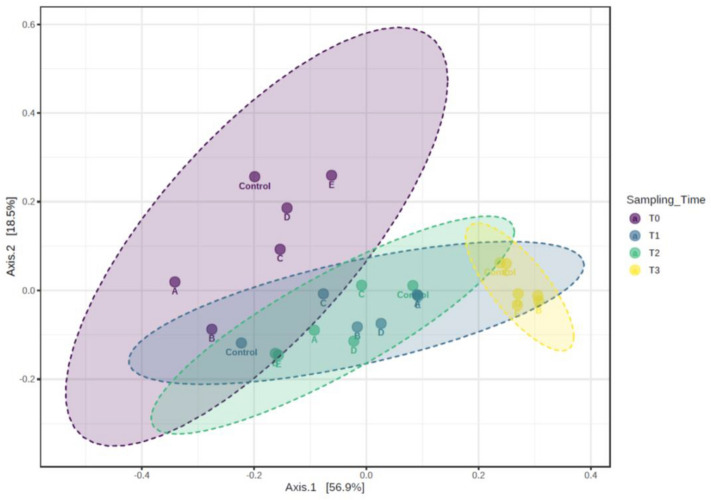
Figure 4.
Principal coordinate analysis (PCoA) based on Bray Curtis ß-diversity. The plot illustrates the distances between bacterial communities in all individual fecal samples (A: Lactobacillus acidophilus CRL 2074; B: Limosilactobacillus fermentum CRL 2085; C: Limosilactobacillus mucosae CRL 2069; D: CRL 2085 + CRL 2069; E: CRL 2074 + CRL 2085 + CRL 2069 treated and untreated (control) at different sampling times (T0, T1, T2 and T3).

