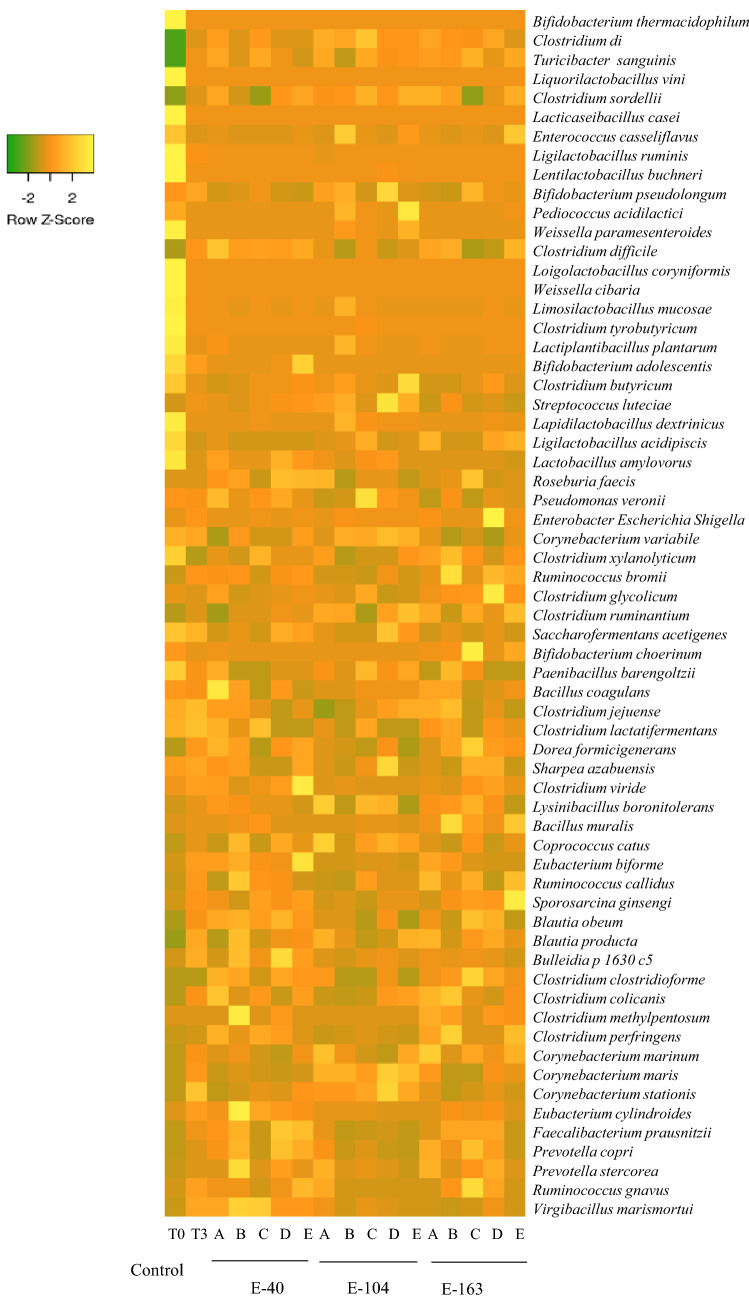
Figure 6.
Heatmap showing the species profile in probiotic-treated (A: Lactobacillus acidophilus CRL 2074; B: Limosilactobacillus fermentum CRL 2085; C: Limosilactobacillus mucosae CRL 2069; D: CRL 2085 + CRL 2069; E: CRL 2074 + CRL 2085 + CRL 2069) and untreated (control) feedlot fecal samples at different experimental administration periods (E-40, E-104 and E-163). For each probiotic group, samples at T3 were considered, while for controls T0 and T3, samples were analyzed. The figure was generated using the heatmap web server http://www.heatmapper.ca/expression/.

