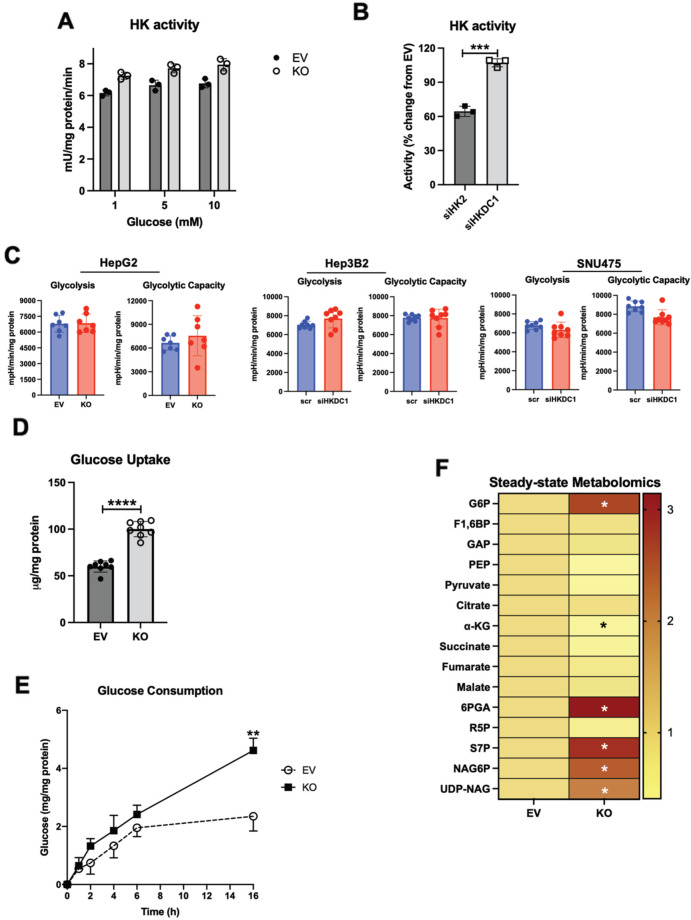
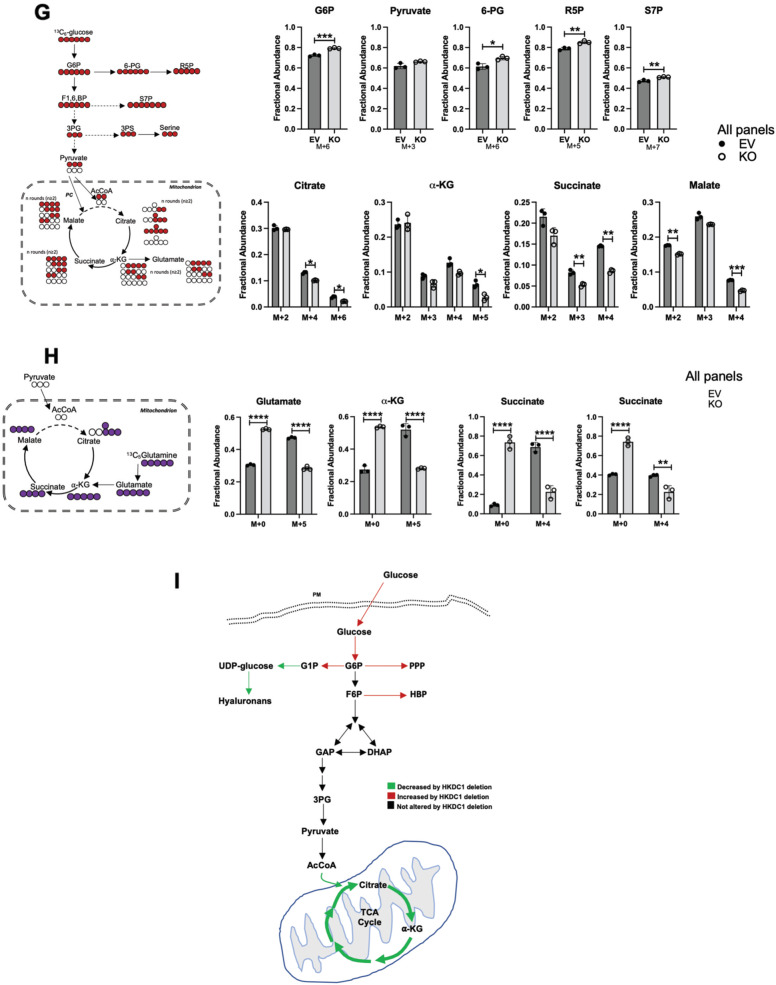
Fig. 4. HKDC1-KO impairs glucose metabolism.
A Hexokinase activity in EV and KO HepG2 cells. B HepG2 cells were treated with siRNA against either HK2 or HKDC1 for 24 h, cells were lysed, and hexokinase activity was assayed. C Seahorse metabolic analysis (ECAR) of EV and HKDC1-KO cells (left panel) and siRNA-mediated HKDC1 knockdown (siHKDC1) in Hep3B2 and SNU475 cells (center and right panels). D 2-NBDG (2-(N-(7-Nitrobenz-2-oxa-1,3-diazol-4-yl)Amino)-2-Deoxyglucose) fluorescent analog of glucose was used to assess glucose uptake in EV and KO HepG2 cells. E In EV and KO HepG2 cells, glucose consumption was assessed by measuring glucose concentration in media aliquots taken at designated time periods, which was subtracted from initial glucose concentration of media, obtaining glucose being consumed by the cells. F Steady-state metabolomics analysis of glycolytic and TCA cycle metabolites in cells cultured under standard growth condition (n = 3, independent biological replicates). G Mass isotopomer analysis of glycolytic and TCA cycle metabolites in cells cultured with 5.5 mM of [U-13C6] glucose and unlabeled glutamine (n = 3, independent biological replicates) for 4 h. H Mass isotopomer analysis of TCA cycle metabolites in cells cultured with 2 mM of [U-13C5] glutamine and unlabeled glucose (n = 3, independent biological replicates) for 4 h. I Schematic summarizing the changes in glucose flux upon HKDC1-KO. Exp A–D were performed 2–3 independent times, with three replicates per individual experiment. Values are ± SD; *p < 0.05; **p < 0.01; ***p < 0.001; ****p < 0.0001 by Student’s t-test (for A–C) or two-way ANOVA (for D–F).


