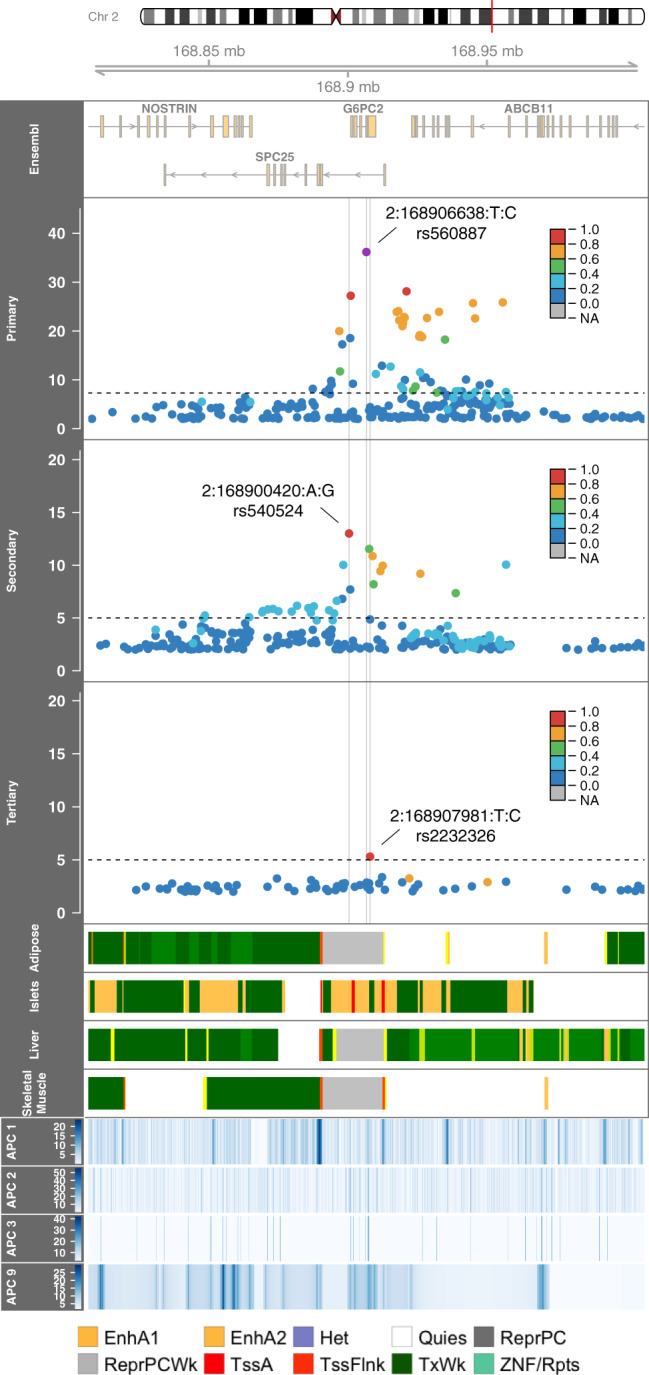
Fig. 2. Regional investigation of three conditionally significant signals associated with fasting glucose in the G6PC2 locus in TOPMed.

Regional association plot of −log10 P values by genomic position for sequential conditional single-variant analyses. The linkage disequilibrium (r2) between the primary signal (rs560887, 2:168906638:T:C), as defined by the highest posterior probability, and variants in the region for each panel as calculated in TOPMed is indicated in the colors of the points. The chromatin states at four relevant tissues47 and annotation PCs are provided across the region. APC1, APC Epigenetics, APC2, APC Conservation, APC3, APC Protein, APC9, APC Distance to TSS/TSE; EnhA1, Active Enhancer 1; EnhA2, Active Enhancer 2; Het, Heterochromatin; Quies, Quiescent/Low; ReprPC, Repressed PolyComb; ReprPCWk, Weak Repressed PolyComb; TssA, Active TSS; TssFlnk, Flanking TSS; TxWk, Weak Transcription; ZNF/Rpts, ZNF genes & repeat.
