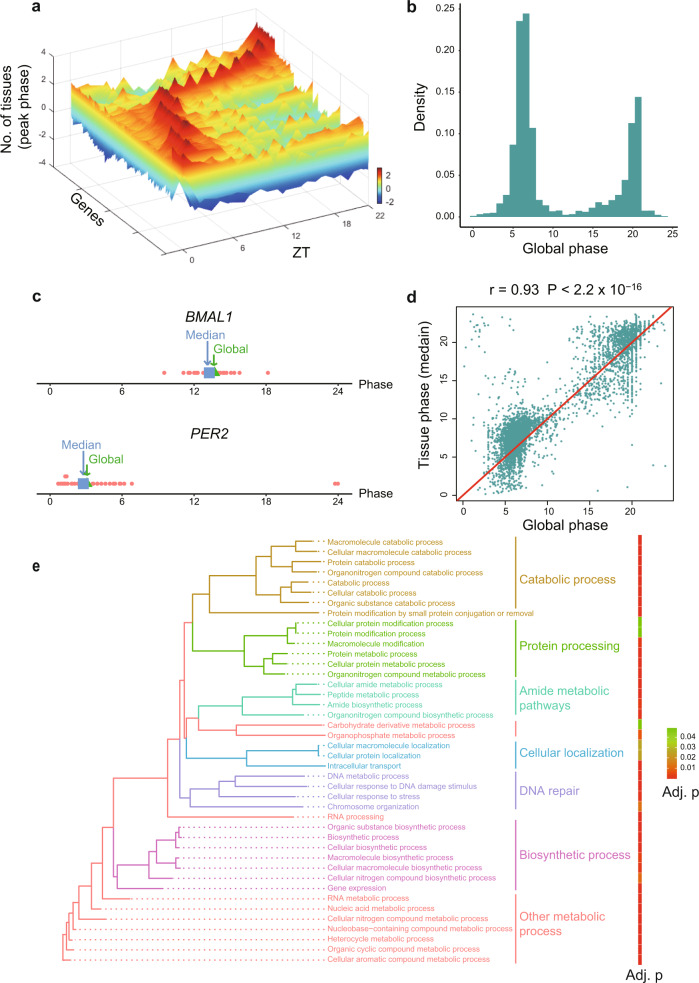
Fig. 1. Global cycling genes and their functions.
a 3D plot of called global cycling genes and the number of organs with peak expression. Scale bar indicates the number of organs with peak expression, with a greater number indicated in red and a lower number indicated in blue. b Phase distribution of global cycling genes. c Global phase (blue) of BMAL1 and PER2 are close to the median phase (green) of individual organs. d The correlation between global phase and median phase in individual organs for all global cycling genes. e The enrichment of biological processes for global cycling genes.

