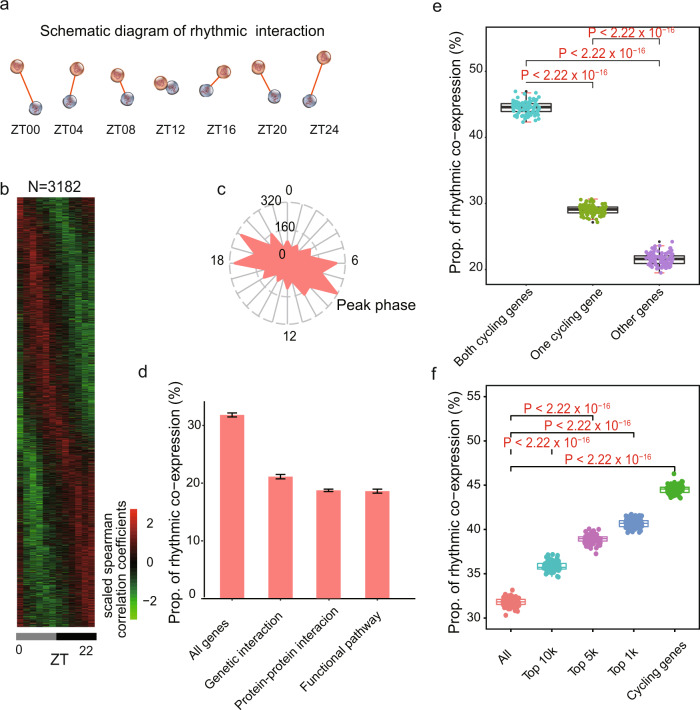
Fig. 2. Properties of rhythmic co−expression interactions.
a Schematic diagram of rhythmic co-expression interactions. Spearman correlation coefficients were used to measure co-expression relationships between gene pairs at given time points. Greater coefficients indicate stronger interactions between gene pairs. b Heatmaps of 3,182 rhythmic co-expression interactions from 10,000 randomly sampled gene pairs. Stronger interactions are marked in red while weaker interactions are marked in green. c Radial plot of the peak phase distribution of rhythmic co-expression links. d Proportion of rhythmic co-expression interactions in different networks, including protein-protein interactions (STRING), genetic interactions (HIPPIE), and functional relevant interactions (KEGG). e Relationships between rhythmic co-expression links and global cycling genes. Gene pairs containing both global cycling genes show the highest percentage of rhythmic interactions while gene pairs containing no global cycling genes show the lowest percentage of rhythmic interactions. f Relationships between rhythmic co-expression links and expression levels. Genes were ranked from highest to lowest, according to their expression levels and top 1,000, 5000, and 10,000 were grouped in the classification.

