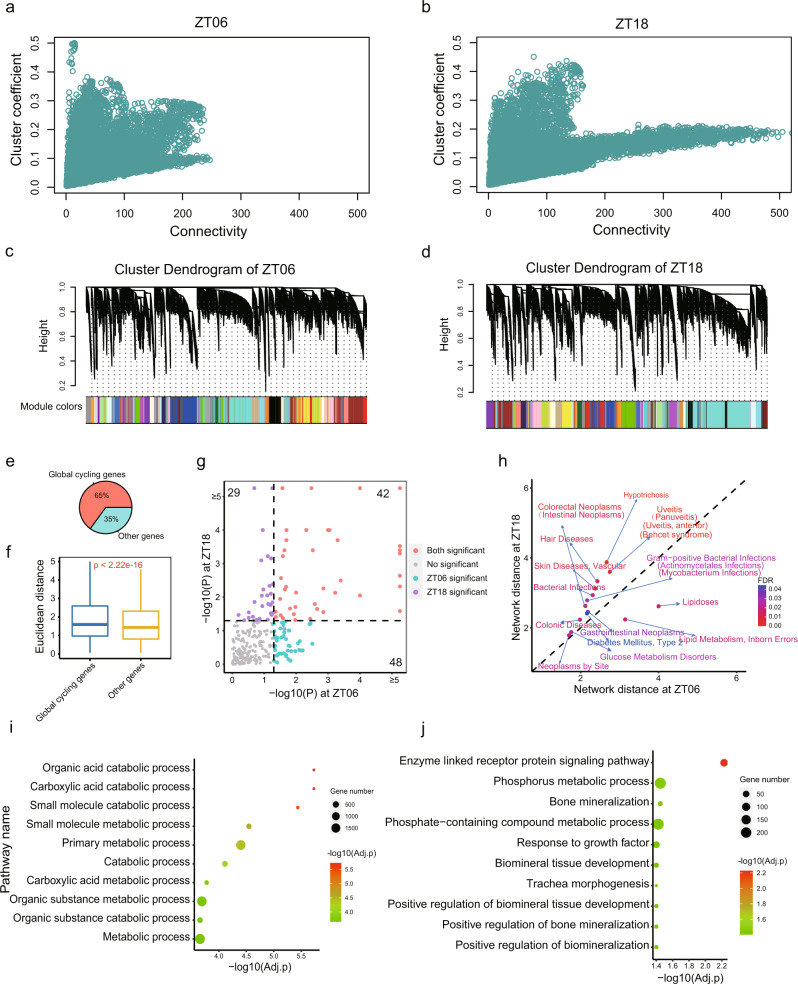
Fig. 5. Network comparisons between phase peaks at noon (ZT06) and midnight (ZT18).
a, b The relationship between connectivity and cluster coefficients at ZT06 and ZT18. c, d Gene clustering dendrogram and module distributions at ZT06 and ZT18, of which 43 and 42 modules were assigned, respectively. e The proportion of global cycling genes and non-cycling genes of all differentially connected genes. f Euclidean distance between global cycling genes and non-cycling genes within the networks. g Significance of the disease modules at ZT06 and ZT18. h The network-based distance of representative disease modules at ZT06 and ZT18 and the statistical significance of the difference. i Top 10 enriched biological pathways of genes with less connectivity at ZT06. j Top 10 enriched biological pathways for genes with less connectivity at ZT18.

