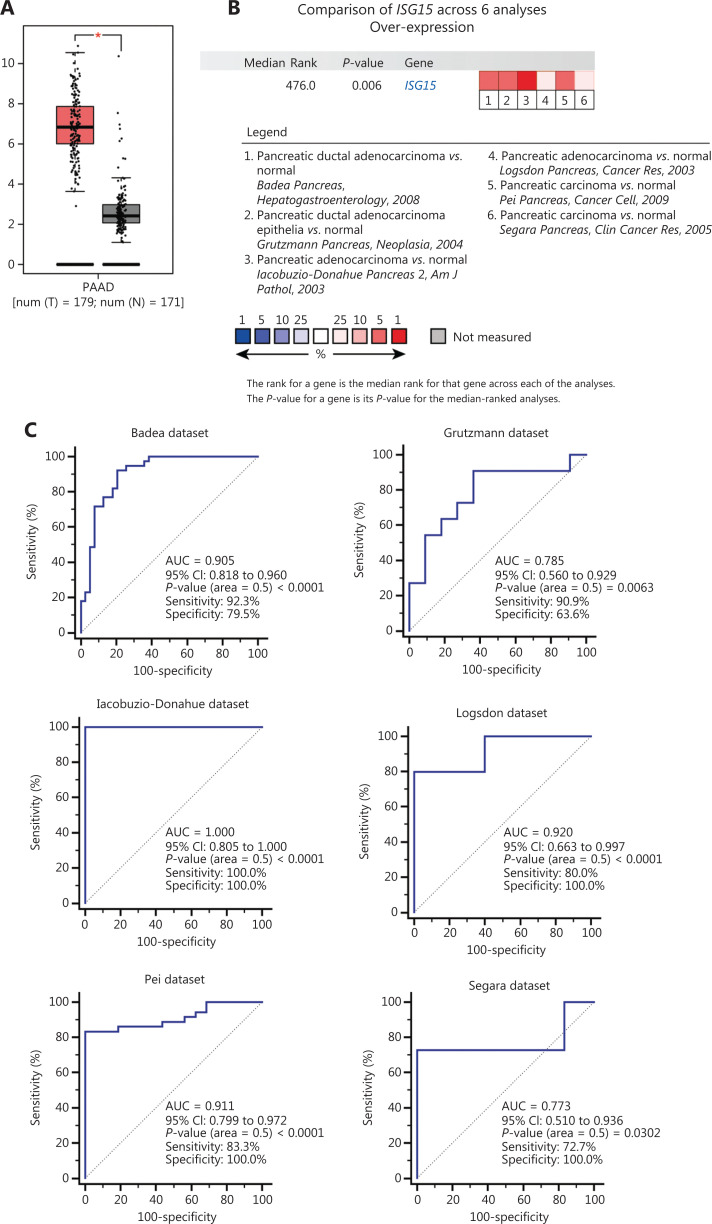
Figure 6.
Analyses of ISG15 mRNA expression in PA patients vs. normal controls for diagnosis. (A) Analysis of ISG15 mRNA expression in PA vs. normal pancreatic tissues from TCGA and GTEx datasets. The following settings were used for the analysis: “expression on box plots”, “gene = ISG15”, “|log2(FC)| cut-off = 1”, “P-value cut-off = 0.01”, “datasets = PAAD”, “log scale = log2(TPM + 1)”, “jitter size = 0.4”, and “matched TCGA normal and GTEx data”. (B) Heat map of ISG15 mRNA expression in PA vs. normal tissues with a P-value < 0.05 from 6 independent datasets from Oncomine. The 6 datasets included the Badea dataset29, Grutzmann dataset41, Iacobuzio-Donahue dataset42, Logsdon dataset43, Pei dataset30, and Segara dataset44. (C) ROC curve analysis of ISG15 mRNA expression with a P-value < 0.05 was used to diagnose PA from the 6 independent datasets from Oncomine. PA, pancreatic adenocarcinoma; T, tumor; N, normal; *P-value < 0.01; TCGA, The Cancer Genome Atlas; GTEx, Genotype-Tissue Expression; FC, fold change; PAAD, pancreatic adenocarcinoma; TPM, transcripts per million; ROC, receiver operating characteristic; AUC, area under the ROC curve; CI, confidence interval.

