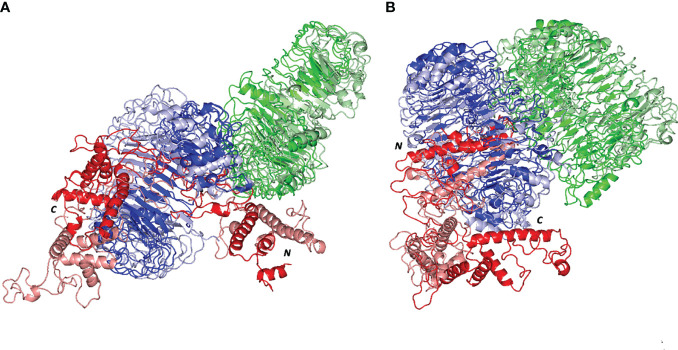
Figure 8.
Comparative dynamic conformation/orientation for the simulated multiepitope vaccine/TLR models. Aligned initial and final simulated trajectories of each model; (A) multiepitope vaccine/TLR-4; (B) multiepitope vaccine/TLR-8. Proteins are represented as 3D cartoons and differently colored in green, blue, or red for respective TLR protomer-A, TLR protomer-B, or the epitope proteins, as well as, in dark or light colors in regard to their respective extracted 0 ns or 100 ns trajectories. The carboxy and amine terminals of the simulated multiepitope vaccines are assigned with C and N-letters, respectively.

