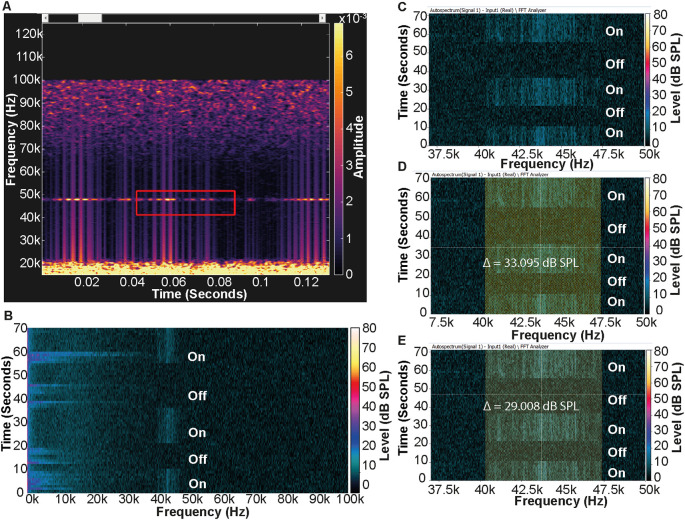
Figure 1. Spectrogram of the noise produced by the ceiling lights.
A) Noise produced by the lights is highlighted in the red box. Spectrogram produced using DeepSqueak (2.6.0) 36 . B) Full frequency range Fast Fourier Transform (FFT) autospectrum from the PULSE system highlighting the ultrasonic noise produced by the fluorescent ceiling lights. The periods when the lights were turned on or turned off are marked. The noise in the lower frequency bands was a result of background noise and movement in the adjacent corridor. C) FFT autospectrum from the PULSE system focused on the frequency range containing the ultrasound produced by the lights. D & E) The delta cursor, indicated in yellow, set to the frequencies spanned by the noise (40.3 kHz–47.4 kHz) measured 33.1 dB SPL when the lights were on (D) and 29 dB when off (E).

