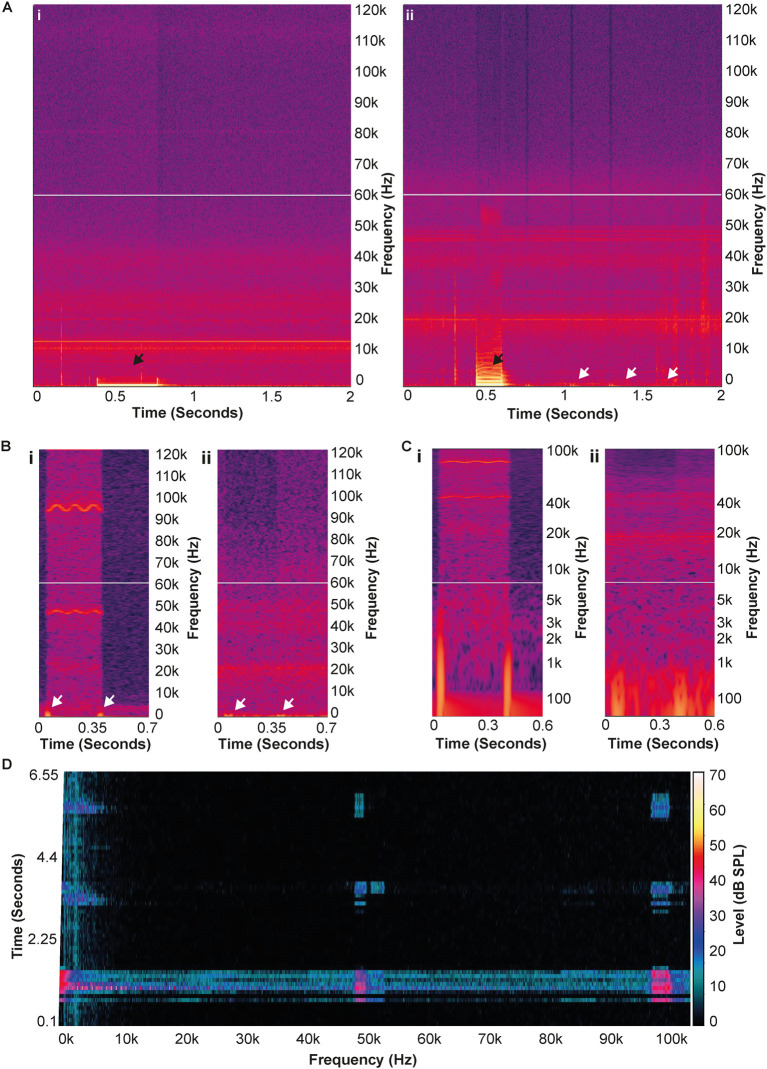
Figure 3. The walkie-talkie noise was likely radio frequencies (RF) interference.
A) Spectrograms of the AudioMoth recordings of the radio being used in an isolated room (i), and in close proximity to an active monitor speaker (ii). The black arrows denote the audible beep produced when the transmit button was pressed. The white arrows in (ii) show the RF interference picked up by the active monitor speaker, while the absence of these in (i) shows that the noise did not arise from the walkie-talkie alone. B) Comparison of the spectrograms from the Avisoft recording (i) and the AudioMoth recording of the radio by the speaker (ii). The white arrows again denote the audible clicks in both recordings, which are not produced by the walkie-talkie itself (as shown in [Ai]); note the ultrasonic noise picked up the Avisoft system are bordered by these clicks. C) The same comparison as (B) using a logarithmic frequency scale to highlight the temporal similarities between the noise from the Avisoft system and the radio being operated in close proximity to the speaker. D) FFT spectrogram using the PULSE software to analyse the recording made by the Avisoft system. Noise can clearly be seen at the same frequencies that were originally detected by the Avisoft system, indicating that if the noise was not an artefact, the PULSE system would have also detected it.

