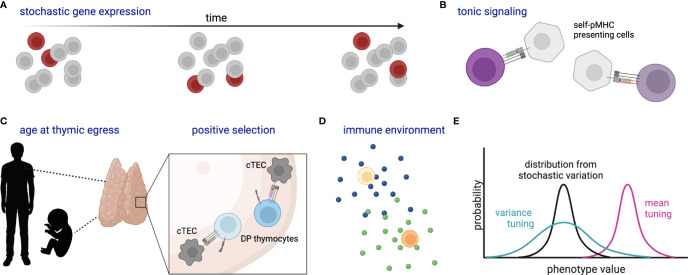
Figure 3.
Schematic of stochastic and deterministic sources of naïve T cell heterogeneity. (A) Stochastic gene expression bursting within a population over time, where dark red cells indicate those cells randomly expressing the gene of interest at each time point. (B) Varied self-pMHC binding of naïve T cells affects gene expression and response characteristics. (C) Likewise, organism age at thymic egress (particularly adult versus fetus) and the strength of self-pMHC interaction during positive selection affect gene expression and response characteristics of peripheral naïve T cells; cTEC, cortical thymic epithelial cell; DP, double-positive. (D) Cytokines and other environmental components tune naïve cell reactivity. (E) Cartoon histograms depict the probability of a cell exhibiting a certain phenotype (e.g. expression of CD8 or a particular metabolic state). Stochastic variation as in (A) creates a distribution (black) which might then be tuned in variance (green) and/or mean (magenta) by additional factors such as (B–D). All cells represent naïve T cells unless otherwise specified. Created with Biorender.com.

