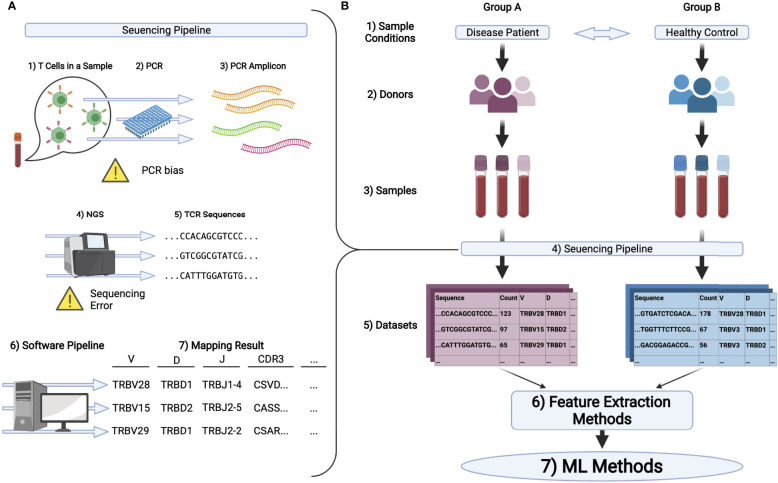
Figure 1.
(A) Schematic illustration of the pipeline in TCR repertoire analysis. 1) First, T cells in samples, typically being collected from peripheral blood, are processed to extract its DNA or RNA of TCRs. 2,3) PCR is conducted to amplify the signal. 4,5) Then, the amplified DNA or cDNA is sequenced by NGS to obtain TCR sequences. 6,7) Finally, these sequences are mapped to the reference genes by the software pipeline introduced in the main text and analyzed further. (B) A typical experimental flow for applying ML methods on repertoire datasets. 1-3) Samples are collected from multiple groups of donors who have different immunological and physiological conditions. 4,5) By the pipeline illustrated in (A), the dataset is obtained for each sample typically in the format of a table or matrix. 6) Datasets are encoded to ML friendly formats (feature vectors) using feature extraction methods. In bioinformatics, it is common to analyze gene expression matrices, which summarize the expression level of each gene for each sample. In repertoire analysis, for each sample, we have a matrix, each raw of which represents the sequence of one TCR, its observation count, its gene usage, and other properties of the TCR. Note that typically 104 to 105 different sequences are observed per sample and that only a limited number of overlapping sequences are usually detected among samples. Therefore, a relatively large sparse matrix must be handled for repertoire analysis. 7) ML algorithms are performed on the encoded datasets.

