
Figure 2. Plasma concentration-time profiles of emtricitabine, dolutegravir and raltegravir for pregnant women and their newborns at delivery.
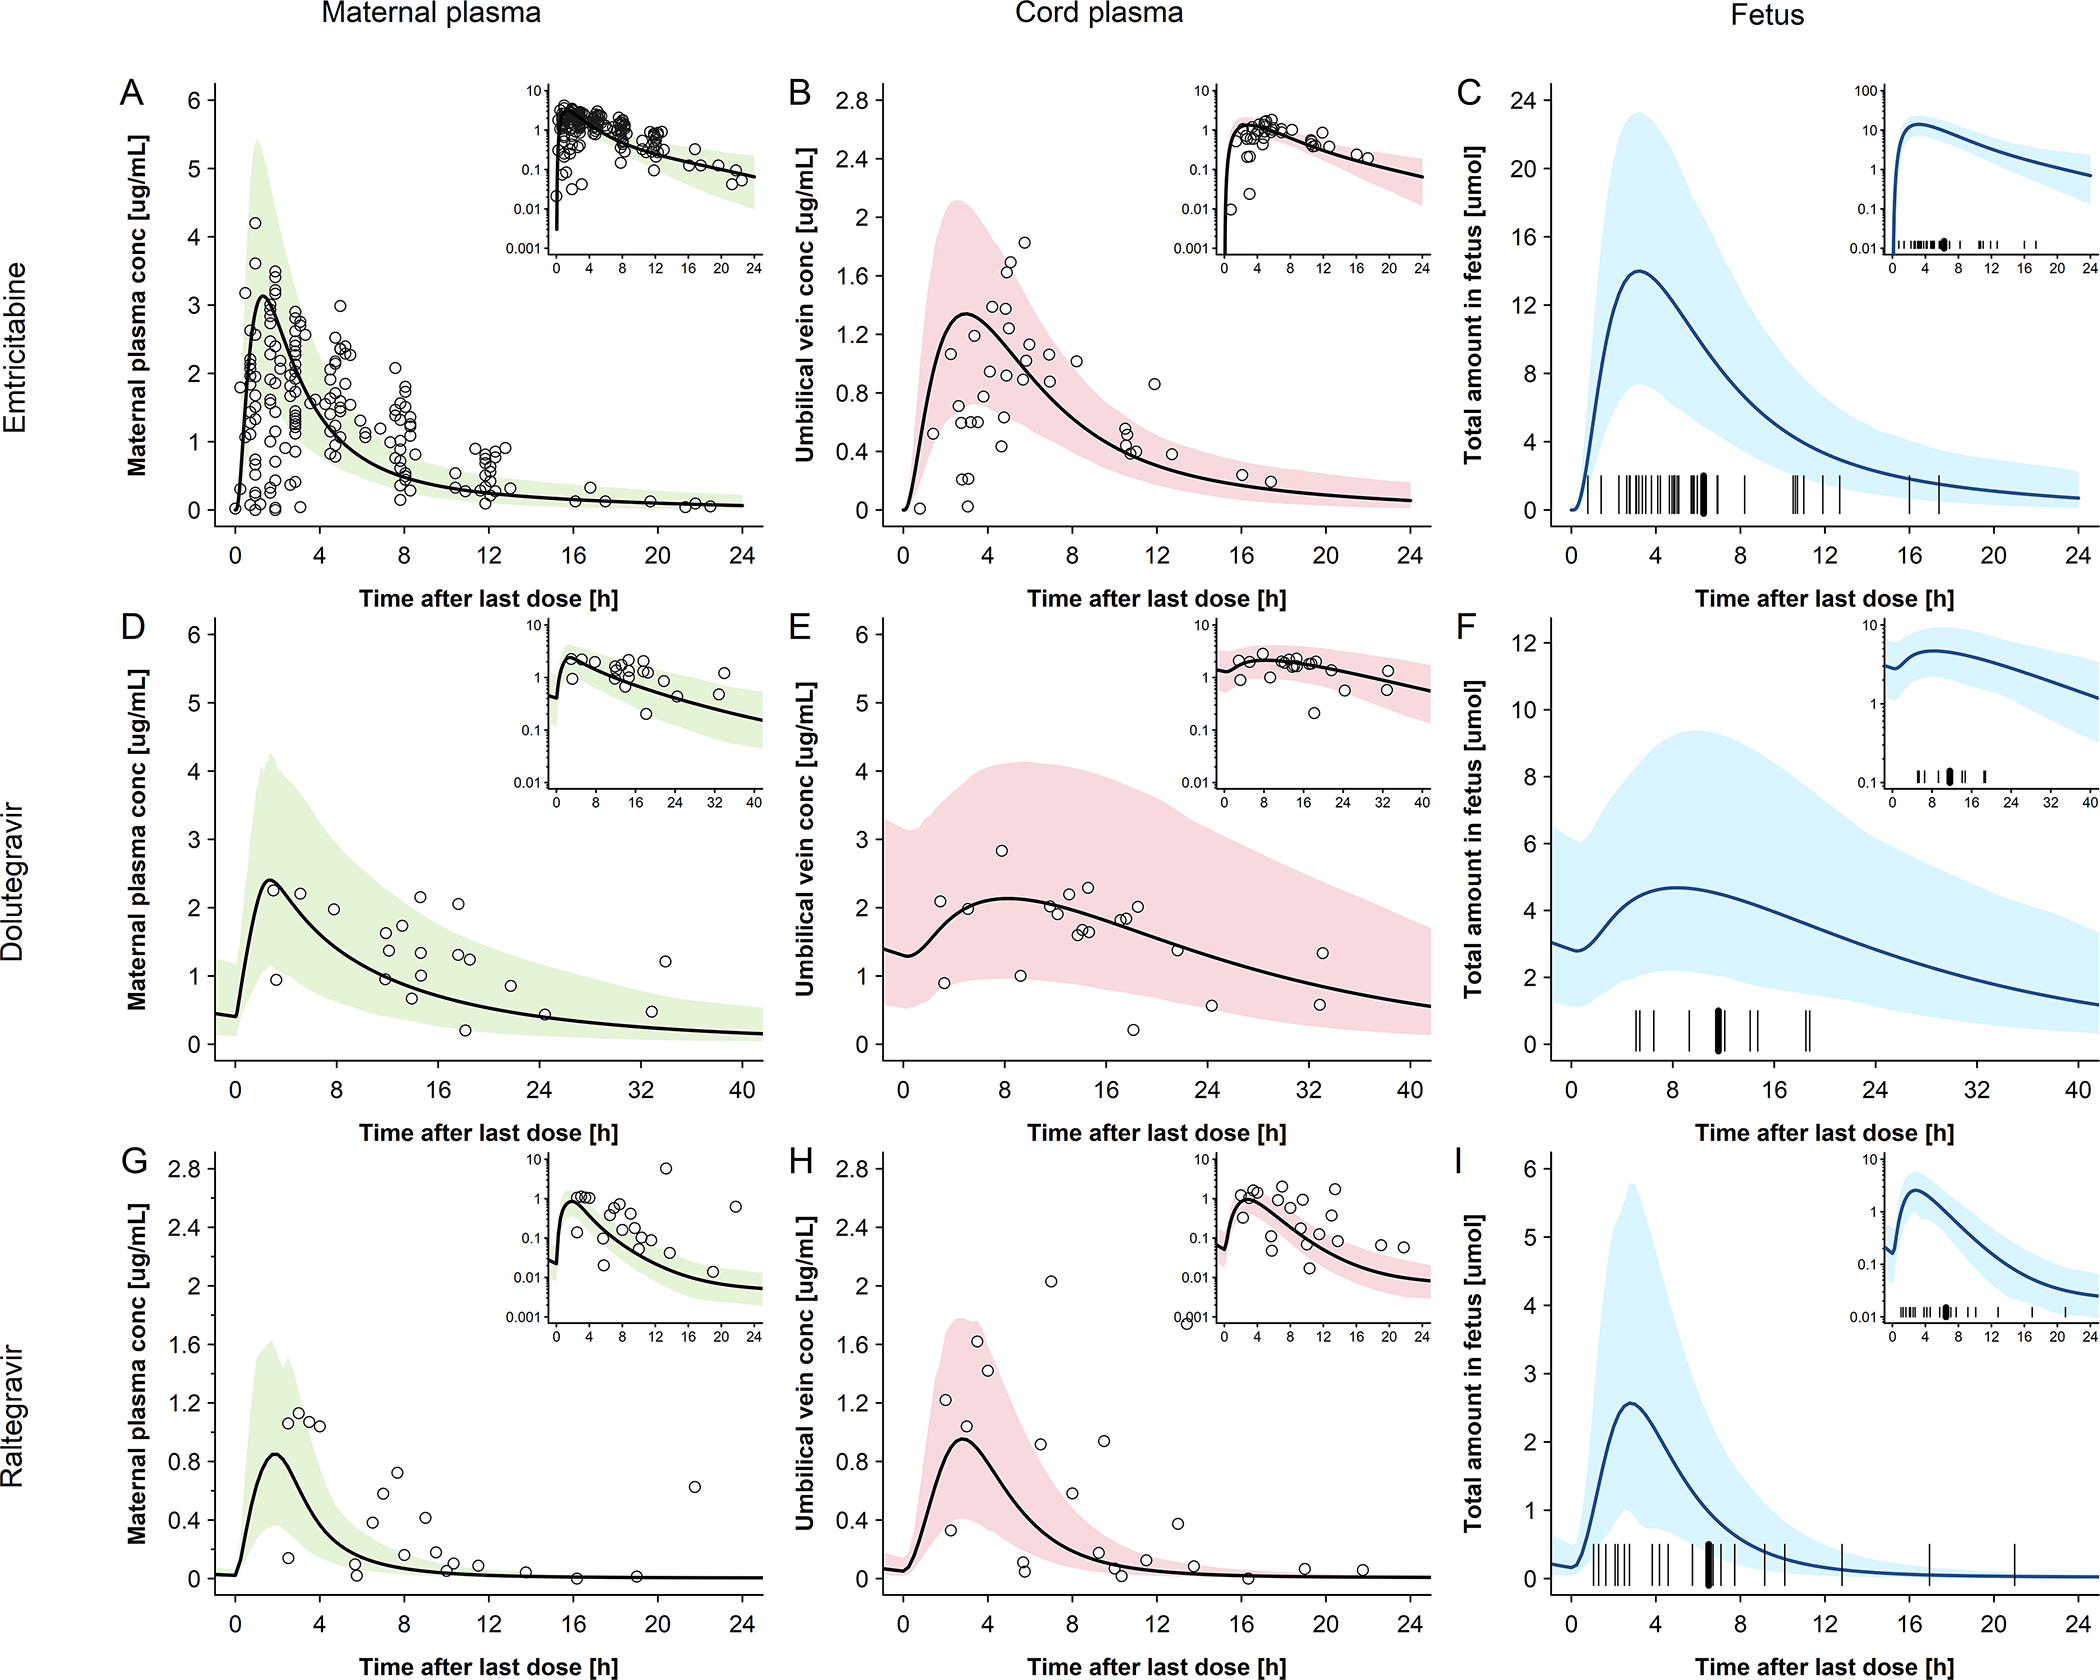
Semi-log scale figures are given as inset figure in the top right corners. Observed steady-state in vivo data were taken from in vivo study of Hirt et al.[17] IMPAACT P1026[10] and Clarke et al.[16] A: emtricitabine 400 mg single dose in pregnant women with an average gestational age of 39 weeks at delivery. Empty circles represent individual concentration data in the maternal plasma taken from in vivo study of Hirt et al.[17]; the line represents the predicted mean concentrations in the maternal plasma; The shaded area represents the predicted 5th – 95th percentile range of the prediction. B: emtricitabine 400 mg single dose in pregnant women with an average gestational age of 39 weeks at delivery. Empty circles represent individual concentration data in the umbilical vein taken from in vivo study of Hirt et al.[17] the line represents the predicted mean concentrations in the umbilical vein. The shaded area represents the predicted 5th – 95th percentile range of the prediction. C: emtricitabine 400 mg single dose in pregnant women with an average gestational age of 39 weeks at delivery. The line represents the predicted mean amount of emtricitabine in fetus. The marks represent the delivery time after last dose. D: dolutegravir 50 mg once a day in pregnant women with an average gestational age of 38 weeks at delivery. Empty circles represent individual concentration data in the maternal plasma taken from in vivo study of IMPAACT P1026;[10] the line represents the predicted mean concentration in the maternal plasma; the shaded area represents the predicted 5th – 95th percentile range of the prediction. E: dolutegravir 50 mg once a day in pregnant women with an average gestational age of 38 weeks at delivery. Empty circles represent individual concentration data in the umbilical vein taken from in vivo study of IMPAACT P1026;[10] the line represents the predicted mean concentration in the umbilical vein. The shaded area presents the predicted 5th – 95th percentile range of the prediction; F: dolutegravir 50 mg once a day in pregnant women with an average gestational age of 38 weeks at delivery; the line represents the predicted mean amount of dolutegravir in fetus. The marks represent the delivery time after last dose. G: raltegravir 400 mg twice a day in pregnant women with an average gestational age of 38 weeks at delivery. Empty circles represent individual concentration data in the maternal plasma taken from in vivo study of Clarke et al.[16]; the line represents the predicted mean concentrations in the maternal plasma; the shaded area represents the predicted 5th – 95th percentile range of the prediction. H: raltegravir 400 mg twice a day in pregnant women with an average gestational age of 38 weeks at delivery. Empty circles represent individual concentration data in the umbilical vein taken from in vivo study of Clarke et al.[16]; the line represents the predicted mean concentrations in the umbilical vein. The shaded area represents the predicted 5th – 95th percentile range of the prediction. I: raltegravir 400 mg twice a day in pregnant women with an average gestational age of 38 weeks at delivery. The line represents the predicted mean amount of raltegravir in fetus. The marks represent the delivery time after last dose.