
Figure 4. Sensitivity analysis of elimination of emtricitabine, dolutegravir and raltegravir in newborns.
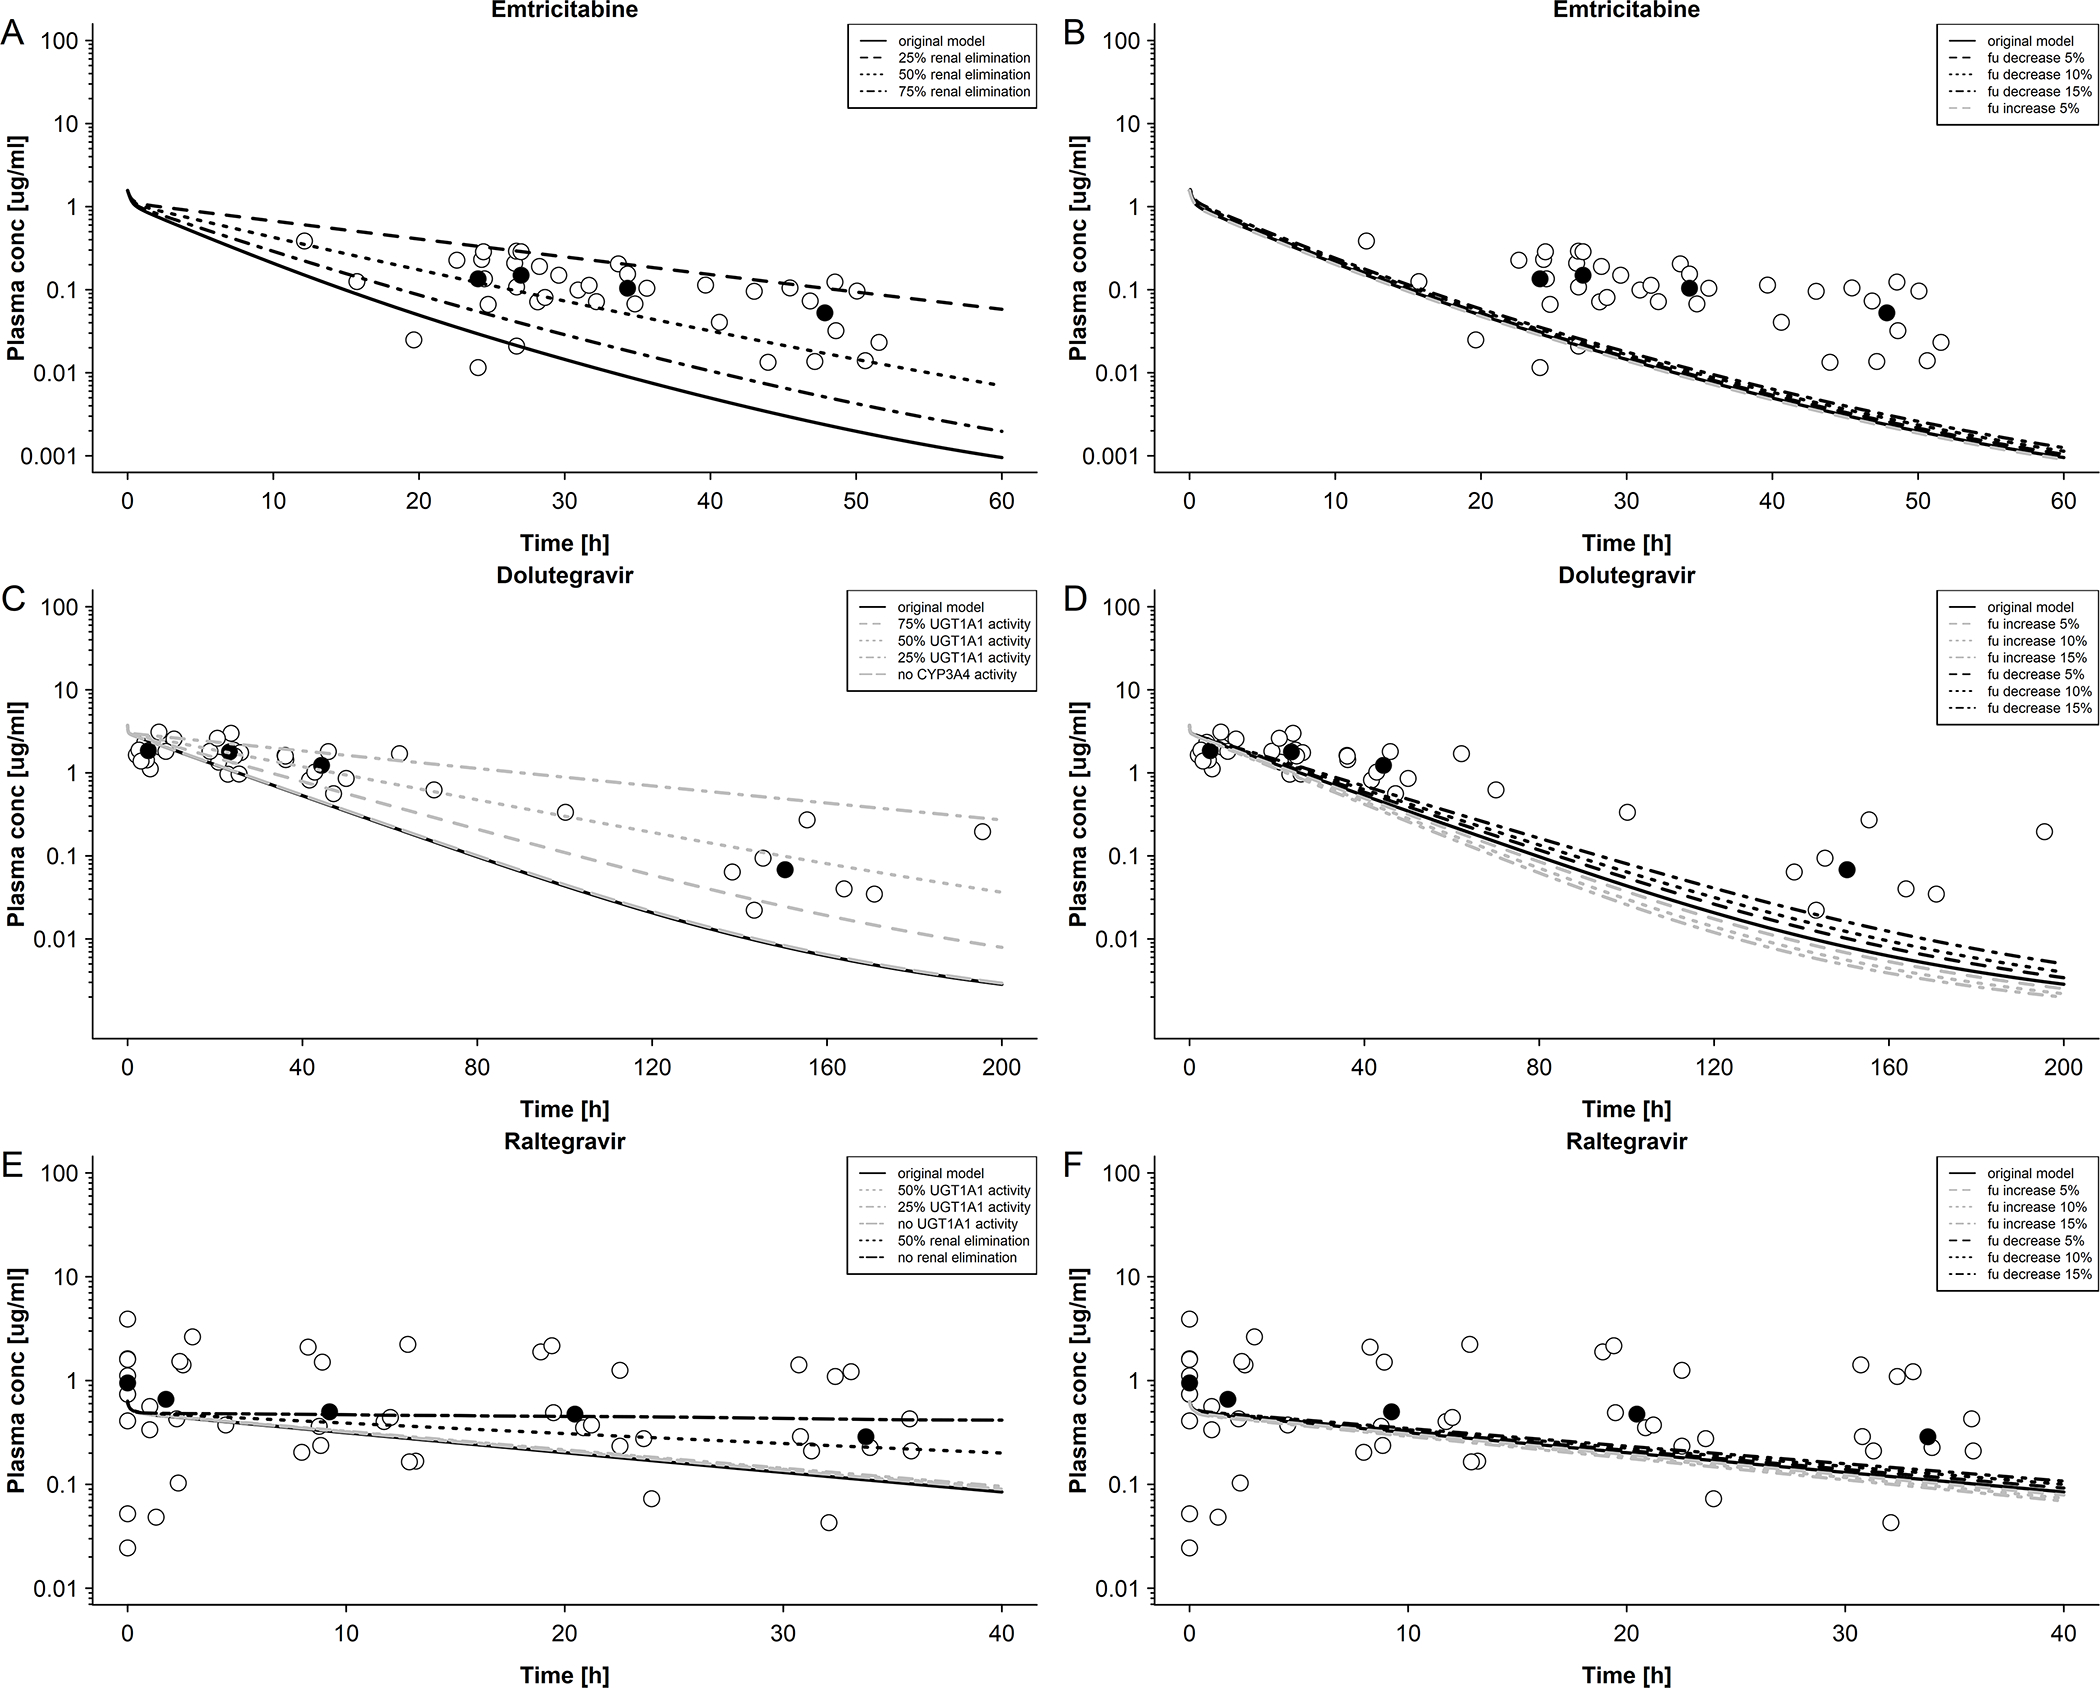
A: Emtricitabine plasma concentration in newborns with differing renal elimination; maternal dose of 400 mg single dose. Empty circles represent observed data were taken from Hirt et al[17] and black circles represent median observed data. B: Emtricitabine plasma concentration in newborns with differing unbound fractions; maternal dose of 400 mg single dose. Empty circles represent observed data were taken from Hirt et al.[17] and black circles represent median observed data. C: Dolutegravir plasma concentration in newborns with differing UGT1A1 and CYP3A4 activities; maternal dose of 50 mg once a day. Empty circles represent observed data were taken from IMPAACT P1026[10] and black circles represent median observed data. D: Dolutegravir plasma concentration in newborns with differing unbound fractions; maternal dose of 50 mg once a day. Empty circles represent observed data were taken from IMPAACT P1026[10] and black circles represent median observed data. E: Raltegravir plasma concentration in newborns with differing UGT1A1 activity and renal elimination; maternal dose of 400 mg twice a day. Empty circles represent observed data were taken from Clarke et al.[16] and black circles represent median observed data. F: Raltegravir plasma concentration in newborns with differing unbound fractions; maternal dose of 50 mg once a day. Empty circles represent observed data were taken from Clarke et al. [16] and black circles represent median observed data.