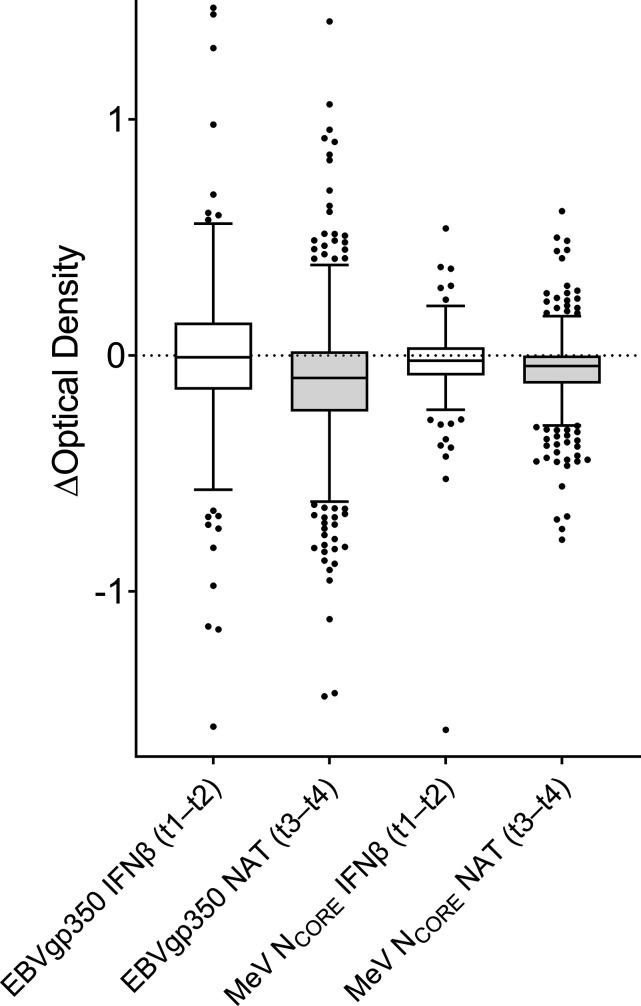
Figure 2.
Tukey box plot illustrating changes in anti-Epstein-Barr virus glycoprotein 350 (EBVgp350) and anti-measles virus nucleocapsid (MeV NCORE) IgG reactivity in serum samples from patients with multiple sclerosis. In all, 170 patients were sampled during interferon (IFNβ) treatment at time point 1 (t1) and t2 and 714 patients were sampled before (t3) and during natalizumab (NAT) treatment (t4). The relative levels of anti-EBVgp350 and anti-MeV NCORE IgG were analysed by indirect ELISA and measured as optical density (OD). The OD value for the first sample taken at t1 or t3 was subtracted from the second value at t2 or t4, creating delta (∆) OD values.

