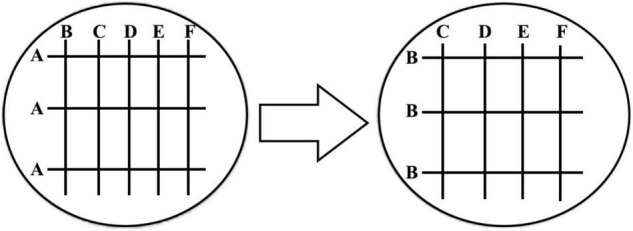
FIGURE 1.

Schematic diagram showing the layout of strain inoculation on plates in the antagonism test. In this figure, A represents a random dominant strain and BCDEF, etc. represent other different dominant strains. After streaking on the plate, we observed whether there was a weak or non-growing antagonistic phenomenon at the intersection of A strain and BCDEF, etc. strain, and if it grew well, there was no antagonistic effect. Further, we observed whether strain B and strain CDEF, etc. were antagonistic, and so on.
