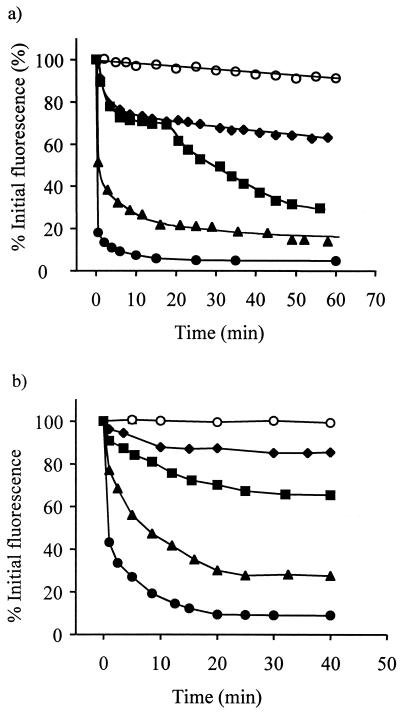
FIG. 1.
Influence of the biocides OIT and sodium hypochlorite on GFP fluorescence in Ap1 gfp blastospores. (a) OIT at concentrations of 0 (○), 50 (♦), 100 (▪), 350 (▴), and 500 (●) μg ml−1. (b) Sodium hypochlorite at concentrations of 0 (○), 25 (⧫), 50 (▪), 75(▴), and 125 (●) μg of available chlorine ml−1. Each point represents the mean of three replicate measurements ± standard error of the mean. (Errors were within the heights of the symbols.)

