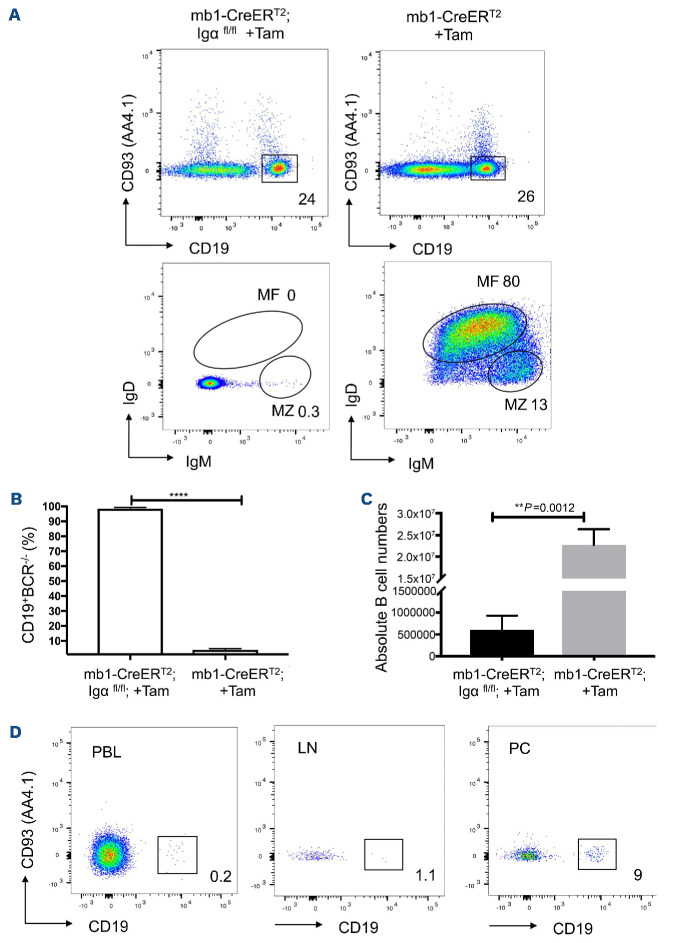
Figure 1.
Efficient deletion of the Igα gene leads to the loss of mature B cells. (A) Flow cytometric analysis of B cells from the spleens of mb1-CreERT2;Igαfl/fl (left) and mb1-CreERT2 control mice (right) treated with tamoxifen (Tam) as described in the Materials and Methods section. Shown are dot plots of the anti-IgM vs. anti-IgD staining after gating on CD19+CD93- mature B cells, 2 weeks post Tam treatment. The gated regions in the dot plots correspond to mature follicular (MF) (IgMlow IgDhigh) and marginal zone (MZ) (IgMhighIgDlow) B cells. The numbers in the dot plots indicate the mean relative frequency of cells in the gate. (B) Quantification of the relative cell count of the Igα-deficient splenic B cells 2 weeks after the beginning of the Tam treatment: bars (left) represent % of cells obtained from mb1-CreERT2;Igαfl/fl mice and bars (right) from mb1-CreERT2 mice. Graphs are presented as mean ± standard error of the mean (SEM). Four asterisks (****) indicate P<0.0001, P-values were obtained using two-tailed Student's t-test. Cell numbers of 5 mice per group are shown. (C) Statistical analysis of absolute cell numbers of mature splenic B cells 8 weeks after Tam and anti-IL-7R treatment: filled bars represent cells obtained from mb1-CreERT2;Igαfl/fl mice and open bars from mb1-CreERT2 mice. Two asterisks (**) indicate P<0.01, P-values were obtained using two-tailed Student's t-test. Cell numbers of 5 mice per group are shown. (D) Flow cytometric analysis of B cells peripheral blood (PBL) (left), lymph nodes (LN) (middle) and peritoneal cavity PC (right) of mb1-CreERT2;Igαfl/fl mice treated with Tam and anti-IL-7R as described in the Materials and Methods section. Shown are dot plots of the anti-CD19 vs. CD93 staining. The numbers in the dot plots indicate the mean relative frequency of cells in the gate. Data shown are representative of 5 mice.

