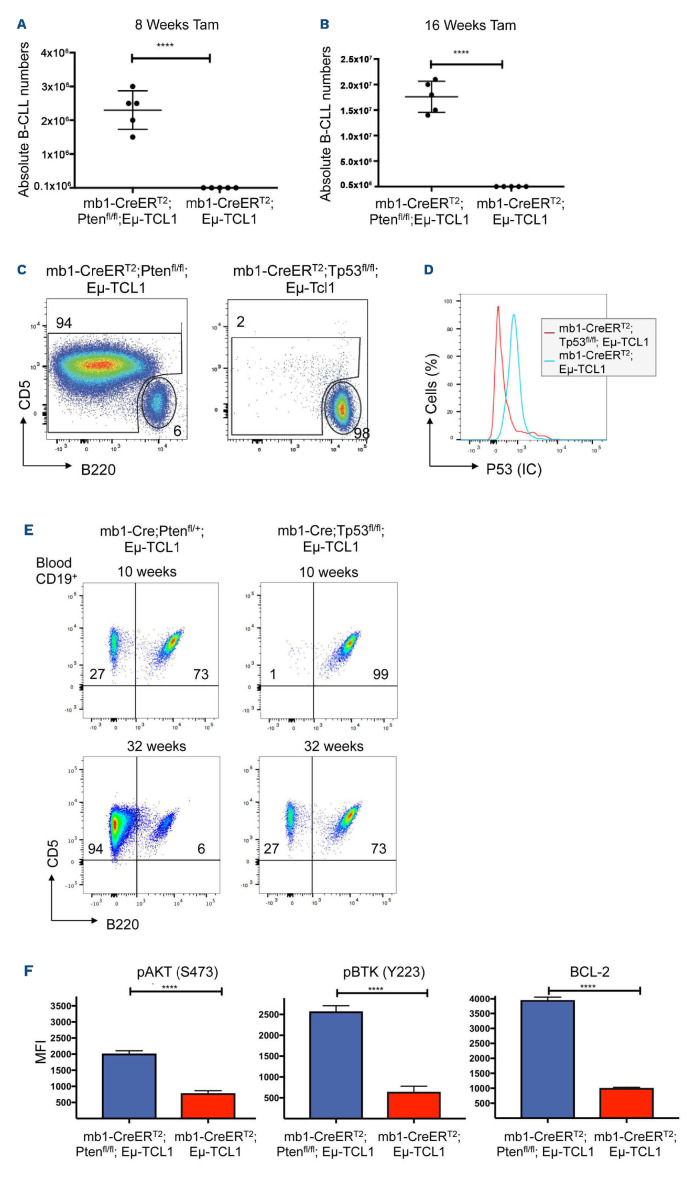
Figure 4.
Deletion of Pten but not Tp53 leads to accelerated mouse chronic lymphocytic leukemia.(A and B) Statistical analysis of absolute cell numbers of chronic lymphocytic leukemia (CLL) cells (CD19+ B220low CD5+) (A) 8 weeks and (B) 16 weeks after tamoxifen (Tam) treatment of 6-week-old mice: filled circles indicating cells obtained from mb1-CreERT2;Ptenfl/fl;Eµ-TCL1 mice (left) and from mb1-CreERT2;Eµ-TCL1 mice (right). Four asterisks (****) indicate P<0.0001, P-values were obtained using two-tailed Student's t-test. Cell numbers from 5 mice per group are shown with each circle representing an individual animal. (C) Flow cytometric analysis of B cells from the spleens of mb1-CreERT2;Ptenfl/fl;Eµ-TCL1 (left ), and mb1-CreERT2; Tp53fl/fl;Eµ-TCL1 (right) 24 weeks after Tam treatment of 6-week-old mice. Shown are dot plots of the anti-B220 vs. anti-CD5 staining after gating on CD19+ B cells. The gated regions in the dot plots correspond to CLL cells (CD19+ B220low CD5+) and healthy B cells (CD19+ B220+ CD5-). The numbers in the dot plots indicate the mean relative frequency of cells in the gate. (D) Flow cytometric analysis of p53-expression in splenic CLL cells from Tam-treated mb1-CreERT2;Tp53+/fl;Eµ-TCL1 mice (red line) and splenic CLL cells from mb1-CreERT2;Eµ-TCL1 mice (blue line). (E) Flow cytometric analysis of B cells isolated from the blood of mb1-Cre;Ptenfl/+;Eµ-TCL1 and mb1-Cre;Tp53fl/fl;Eµ-TCL1 mice at the age of 10 weeks and 32 weeks. The graph shows dot-plots of the anti-B220 vs. anti-CD5 staining after gating on viable CD19+ B lymphocytes. The numbers in the dot plots indicate the mean relative frequency of cells in the gate. (F) Quantification of p-AKT (left) and p-BTK (middle), and BCL-2 (right) mean fluorescence intensity (MFI) in splenic mouse CLL B cells from mb1-CreERT2;Ptenfl/fl;Eµ-TCL1 (blue filled bars) and mb1-CreERT2;Eµ-TCL1 (red filled bars) mice. Mean ± standard deviation are shown. Four asterisks (****) indicate P<0.0001, P-values were obtained using two-tailed Student's t-test. Results from 5 mice per group are shown.

