Figure 6.
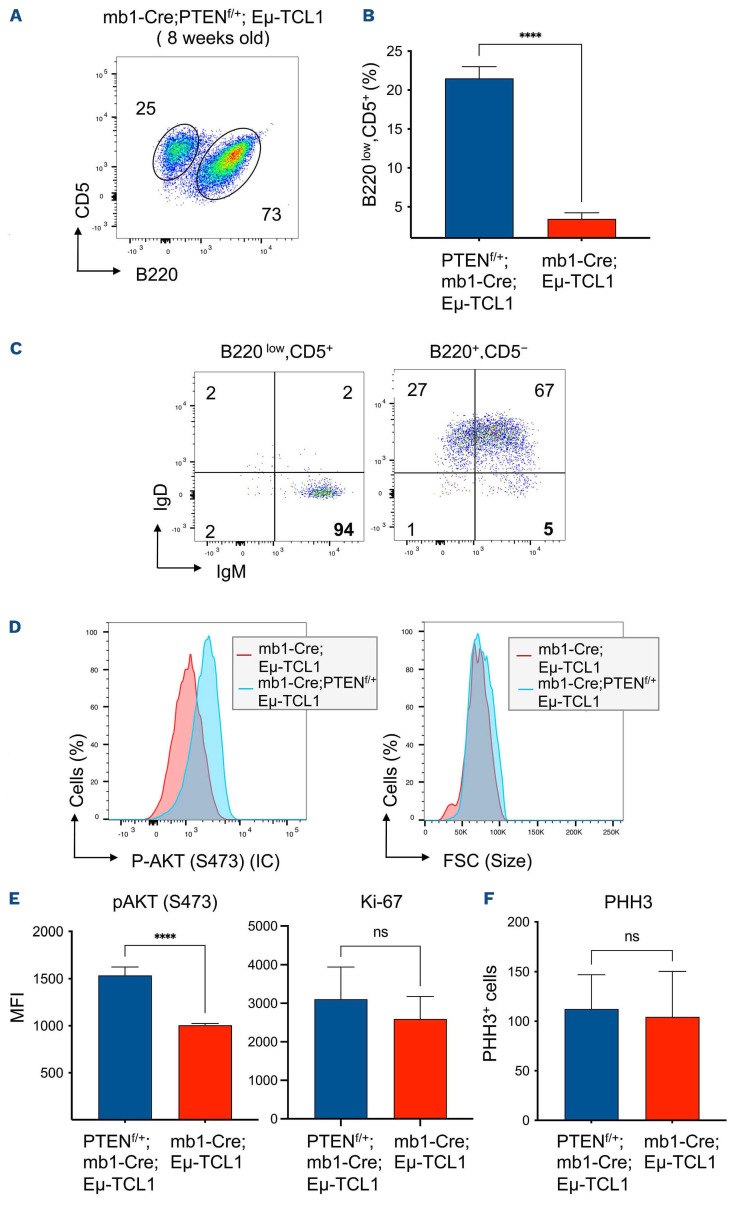
A single deleted Pten allele is enough to accelerate the onset of chronic lymphocytic leukemia. (A) Flow cytometric analysis of B cells from the spleens of mb1-Cre;Ptenfl/+;Eµ-TCL1 mice. Dot plot of the anti-B220 vs. anti-CD5 staining after gating on CD19+ B cells. The gated regions in the dot plots correspond to chronic lymphocytic leukemia (CLL) cells (CD19+ B220low CD5+) and healthy mature B cells (CD19+ B220+ CD5-). The numbers in the dot plots indicate the mean relative frequency of cells in the gate. (B) Quantification of the relative number of (CD19+ B220low CD5+) splenic mouse B cells from mb1-Cre;Ptenfl/+;Eµ-TCL1 (blue filled bars) and mb1-Cre;Eµ-TCL1 (red filled bars) mice. Graphs are presented as mean ± standard error of the mean (SEM). Four asterisks (****) indicate P<0.0001, P-values were obtained using two-tailed Student's t-test. Results from 5 mice per group are shown. (C) Dot plot of the anti-IgM vs. anti-IgD staining after gating on CD19+ B220low CD5+ (left) and CD19+ B220+ CD5- (right). The gated regions in the dot-plots correspond to CLL cells (IgMhighIgD-) and healthy mature B cells (IgM+IgDhigh). The numbers in the dot-plots indicate the mean relative frequency of cells in the quadrants. (D) Flow cytometric analysis showing histograms overlays of AKT-phosphorylation (left) and size (right) of splenic B cells from mb1-Cre;Eµ-TCL1 (red line) and mb1-Cre;Ptenfl/+;Eµ-TCL1 mice (blue line). (E) Quantification of AKT phosphorylation (left) and Ki-67 (right) mean fluorescence intensity (MFI) in splenic mouse CLL B cells from mb1-Cre;Ptenfl/+;Eµ-TCL1 (blue filled bars) and mb1-Cre;Eµ-TCL1 (red filled bars) mice. Graphs are presented as mean ± SEM. Four asterisks (****) indicate P<0.0001, P-values were obtained using two-tailed Student's t-test (****P<0.0001; ns=not significant). Results from 5 mice per group are shown. (F) Quantification of PHH3 positive cells of the splenic sections from diseased mb1-Cre;Ptenfl/+;Eµ-TCL1 and mb1-CreERT2; Eµ-TCL1 mice. Graphs are presented as mean ± SEM; bars show the mean value of 6 analyzed pictures per spleen. P-values were obtained using two-tailed Student's t-test (ns=not significant). Results from 4 mice per group are shown.

