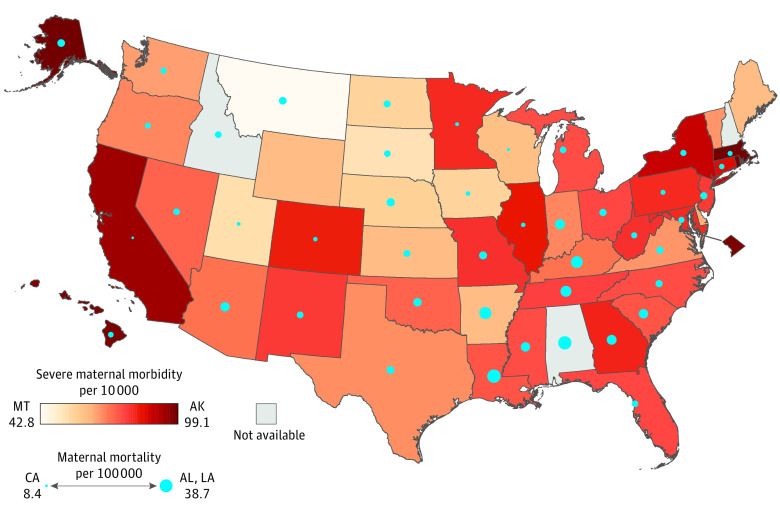
Figure. Severe Maternal Morbidity and Maternal Mortality Rates by State.
Severe maternal morbidity per 10 000 delivery hospitalizations was determined from the Healthcare Cost and Utilization Project–State Inpatient Databases, 2017 to 2019. State rates of severe maternal morbidity are displayed in a sequential red color scheme, with darker red indicating higher rates. Maternal mortality per 100 000 live births was determined from the National Vital Statistics System, 2016 to 2020; a checkbox to indicate pregnancy on the death certificate was not in use or did not follow national standards for California (all years) and West Virginia (2016 to mid-2017). State rates of maternal mortality are displayed in proportional blue circles with larger circles indicating higher rates.

