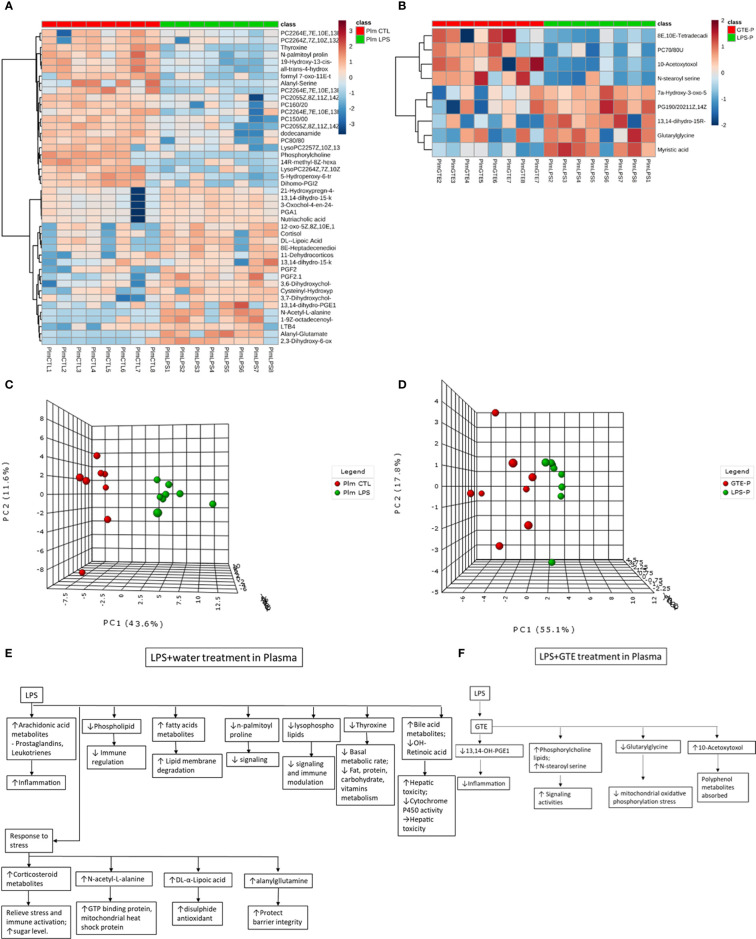
Figure 2.
Heatmaps of metabolites showed patterns of differential metabolite profiles between different treatment groups in plasma. (A) Between controls and EIU as induced by LPS in the plasma; (B) Between EIU induced by LPS and after GTE treatment in the plasma Principal component analysis (PCA) showed (C) comparison of controls and EIU induced by LPS, (D) comparison of EIU induced by LPS and after GTE treatment samples in plasma. Metabolites and their associated biological activities were shown in (E) the plasma of the EIU rats induced by LPS, and (F) the plasma of the EIU rats after GTE treatment.

