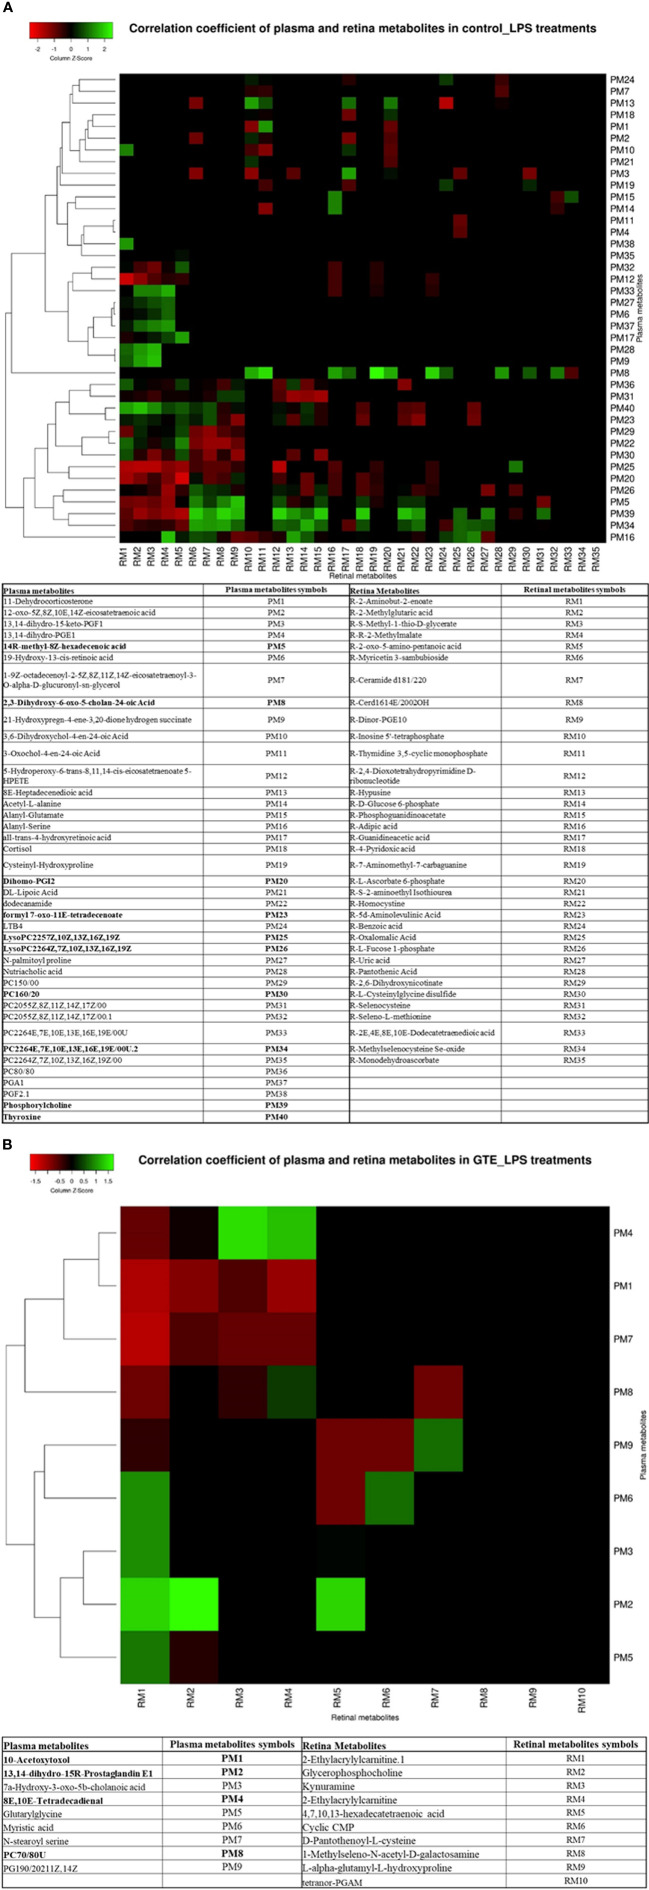
Figure 4.
Heatmap showing the correlation coefficients between systemic metabolites in the plasma associated with metabolites in the retina of EIU rats before and after GTE treatment. The labeled metabolites are the plasma metabolites that gave correlations (r > 0.5 or r < -0.5; p < 0.05) with metabolites in the retina. The heatmaps show the correlation coefficients between systemic metabolites regulation associated with (A) metabolites in the retina under LPS induction, and (B) metabolites in the retina under GTE treatment. The tables show the labeled metabolites corresponding to the metabolites present in the plasma and the retina. The bold plasma metabolites in the tables indicate that those metabolites give higher correlation coefficients and have wider coverage to the metabolites present in the retina.

