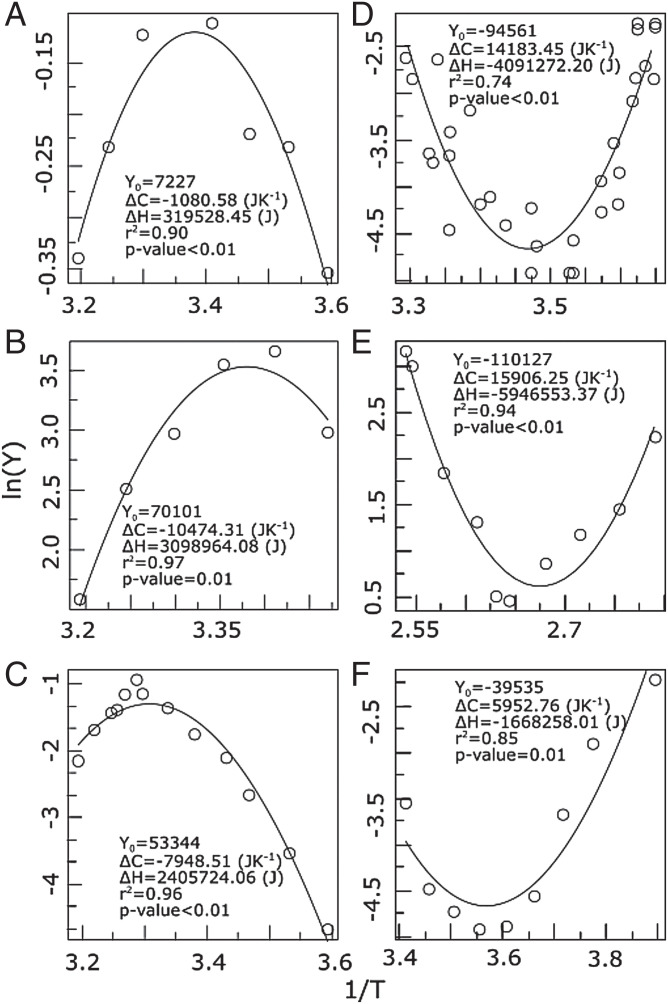
Fig. 1.
Temperature response curves compared to the predictions of Eqs. 5 and 7 for a wide diversity of biological examples. Plotted are vs. (in 1/K, where K is kelvin) showing (A–C) convex patterns and (D–F) concave patterns: (A) metabolic rate in the multicellular insect Blatella germanica, (B) maximum relative germination in alfalfa (for a conductivity of 32.1 dS/m), (C) growth rate in Saccharomyces cerevisiae, (D) mortality rate in the fruit fly (Drosophila suzukii), (E) generation time in the archaea Geogemma barossii, and (F) metabolic rate (during steady-state torpor) in the rodent Spermophilus parryii. Here the curve corresponds to the metabolic rate in response to environmental temperature and not body temperature. The x axis is in units of . Examples come from references 58–63.

