Fig. 2.
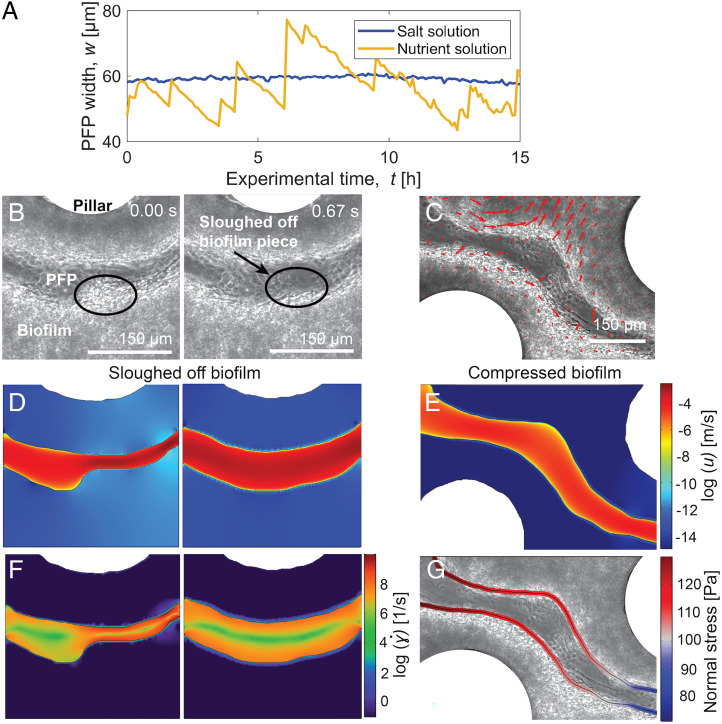
In the intermittency observed in PFPs, PFP closing is driven by microbial growth, while PFP opening is driven by hydrodynamically induced stresses on the biofilm. (A) For a mature biofilm, replacing the flowing nutrient solution with a nutrient-free salt solution causes the intermittency in the PFP width to cease (blue curve), in comparison with continued intermittency under constant nutrient flow (yellow curve). This demonstrates that PFP closing is driven by microbial growth. Before data collection, biofilms were allowed to develop for 24 h, and the solution within the porous medium was allowed to equilibrate for 2 h after the change to a salt solution, before flow was resumed. Bright-field image sequences of the biofilms corresponding to this data are shown in SI Appendix, Fig. S4. (B) Images acquired in rapid sequence during PFP opening, showing the detachment of a portion of the biofilm (area ∼3,600 µm2) adjacent to the PFP. The black ellipse indicates the location of the sloughed-off biofilm. (C) DIC analysis of high-speed videos showing biofilm movement during PFP opening through compression of the biofilm structure. Red arrows indicate local movement within the biofilm mostly normal to the PFP, with larger arrows signifying a larger local biofilm movement. (D, E) Numerically computed fluid velocity u (note logarithmic color scale) for the geometries corresponding to the images in B and C, showing higher velocities in the narrower PFP regions. (F) Shear rate (note logarithmic color scale) computed from the numerical velocity field. Shear rates next to the PFP boundaries are much higher in a narrow path compared to an open path. (G) The stress normal to the PFP boundaries, obtained from the numerical simulations.

