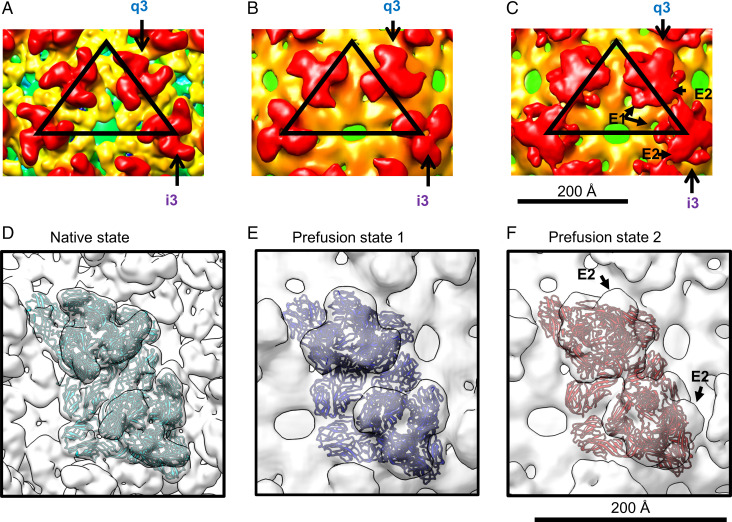
Fig. 2.
Interpretation of cryo-EM reconstructions of native, prefusion state 1, and prefusion state 2 of EEEV. (A) Native EEEV. The EEEV map (EMD-20025) (12) was low-pass filtered to 14.3 Å for comparison with structures shown in B and C. (B) Prefusion state 1 of EEEV. (C) Prefusion state 2 of EEEV. E1 and E2 densities from q3 and i3 spikes are labeled and highlighted by arrows (a description is in Fig. 1A). The black triangles indicate an asymmetric unit in each of the cryo-EM reconstructions. (D) Rigid body–fitted E1–E2 model (cyan) in the localized-reconstruction native EEEV map (white). (E) MDFF-fitted E1–E2 model (blue) in the localized-reconstruction prefusion state 1 of the EEEV map (white). (F) MDFF-fitted E1–E2 model (red) in the localized-reconstruction prefusion state 2 of the EEEV map (white). Procedures for the model fitting in D–F are also described in Materials and Methods and SI Appendix, Fig. S5.

