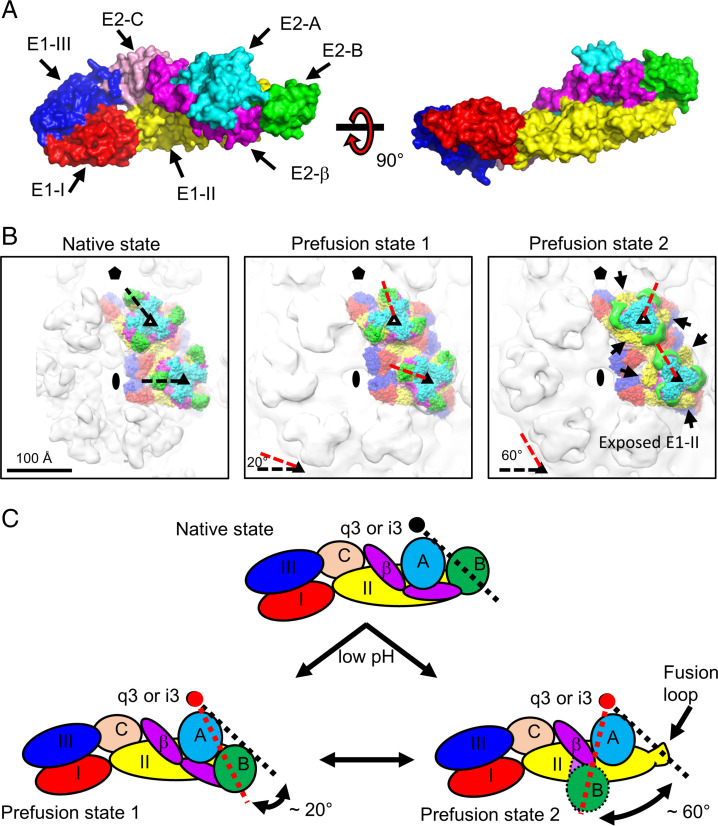
Fig. 3.
Domain mapping of E1–E2 glycoproteins in the native and two low-pH EEEV structures. (A) Surface representation of the E1–E2 ectodomains. Domains from E1 and E2 glycoproteins are colored separately and labeled accordingly. Residue ranges were used for defining the domain boundaries. E1-I (red): 1 to 38, 130 to 169, and 273 to 293; E1-II (yellow): 39 to 129 and 170 to 272; E1-III (dark blue): 294 to 381; E2-A (cyan): 1 to 134; E2-B (green): 170 to 228; E2-C (light pink): 266 to 340; E2-β (magenta): 135 to 169 and 229 to 265. (B) Domain mapping in the structures of native (Left), prefusion state 1 (Center), and prefusion state 2 (Right) of EEEV. Domains are colored coded as described for A. Symmetry elements are marked as described in Fig. 1A. In Right, arrows indicate the exposure of E1-B (yellow). (C) Cartoon diagrams of E1–E2 ectodomains under native (Upper) and acidic (Lower Left and Lower Right) conditions for demonstrating the rotation of E2-B. The black circle indicates the center of the q3 or i3 spike. In prefusion state 2, unresolved regions of E2-B (circle with dashed outline) and a part of β-ribbon (oval with dashed outline) are highlighted. In B and C, black and red dashed lines indicate the E2-B positions at native and low-pH states, respectively.

