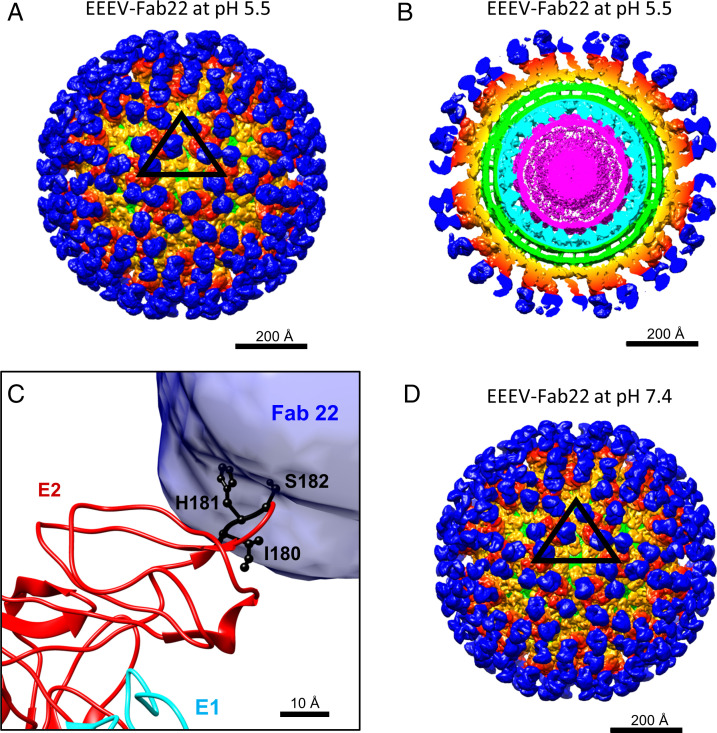
Fig. 4.
Cryo-EM reconstructions of EEEV bound to Fab22 under low-pH and neutral pH conditions. In A, B, and D, densities belonging to Fab22 (blue), E1–E2 glycoproteins (orange and red), the viral membrane (green), capsid proteins (cyan), and the viral RNA genome (magenta) are highlighted. (A) Cryo-EM reconstruction of EEEV–Fab22 at low pH. The black triangle indicates an asymmetric unit as described in Fig. 1A. (B) Central section of the cryo-EM reconstruction of low-pH EEEV–Fab22 as presented in A. (C) Superimposition of the EEEV E1–E2 glycoprotein model with the difference map generated by subtracting the native EEEV densities from the low-pH EEEV–Fab22 map. E1 (cyan) and E2 (red) glycoproteins are labeled, and the Fab22 density is shown in blue. Key binding residues for EEEV-22 (I180, H181, and S182) are colored in black. (D) Cryo-EM reconstruction of EEEV–Fab22 at neutral pH. The map resolution was estimated to be ∼6.7 Å (Table 1 and SI Appendix, Fig. S7B).

