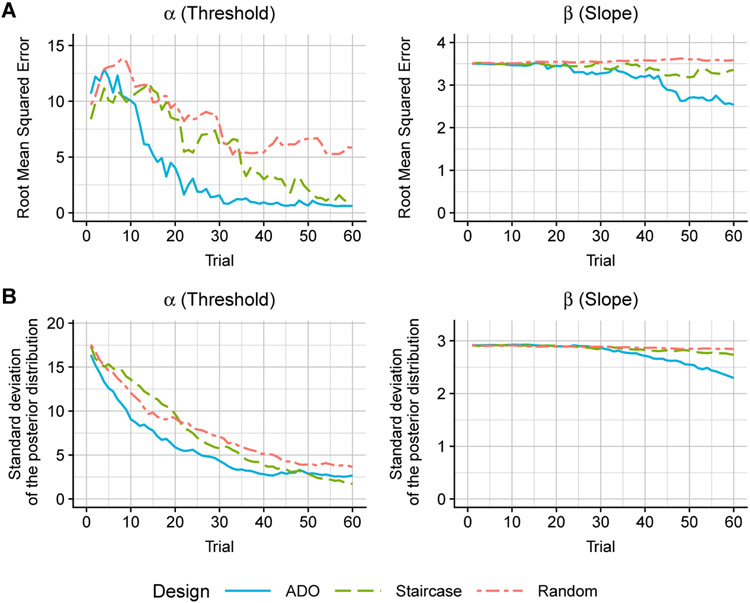
Fig. 6:
Comparison of ADO, staircase, and random designs in the simulation of psychometric function estimation. Simulations were conducted using the logistic model with parameter values of threshold α = 20, slope β = 1.5, guess rate γ = 0.5, and lapse rate δ = 0.04. The three designed are compared with root mean squared errors (RMSE; Panel A) and standard deviations of the posterior distribution (Panel B). RMSE represents the discrepancy between true and estimated parameters in that the lower RMSE, the better estimation performance. Standard deviations of the posterior distribution indicate the certainty of a belief on the distribution for model parameters, i.e., the lower the standard deviations is, the higher certainty on the model parameters. Each curve represents an average across 1,000 independent simulation runs.

