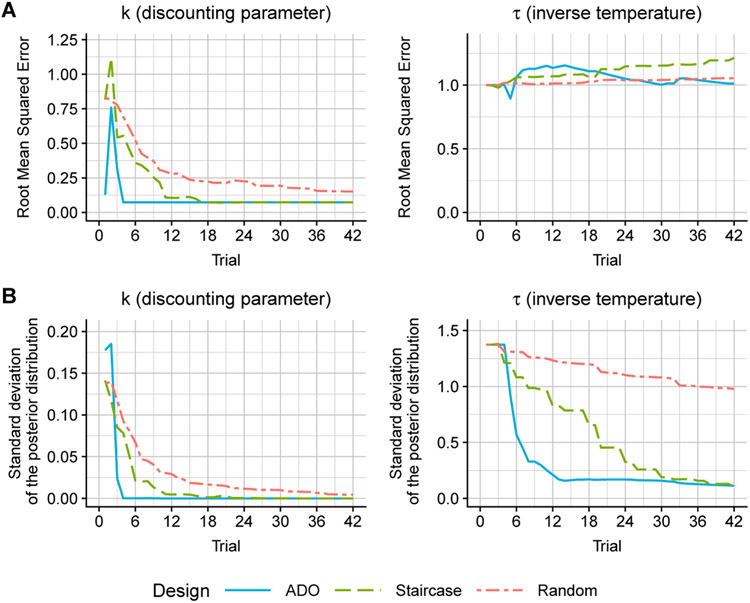
Fig. 7:
Comparison of ADO, staircase, and random designs in the simulation of the delay discounting task. Simulations were conducted using the hyperbolic model with parameter values of k = 0.12 and τ = 1.5. The three designs are compared with root mean squared errors (RMSE; Panel A) and standard deviations of the posterior distribution (Panel B). Each curve represents an average across 1,000 independent simulation runs.

