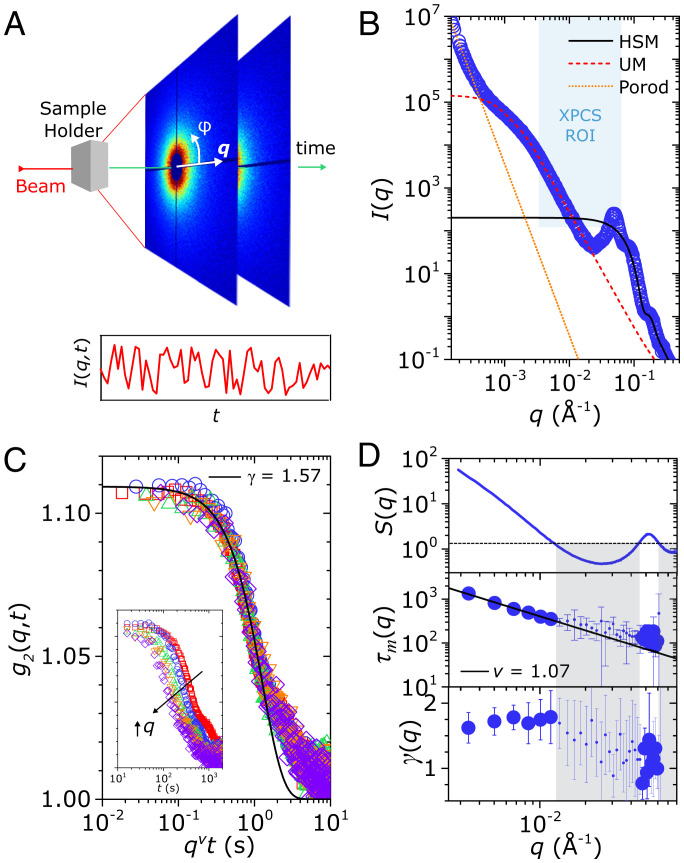
Fig. 2.
Microscopic dynamics of the arrested gel probed at quiescence via XPCS. (A) Illustration of the XPCS experimental setup. A partially coherent synchrotron X-ray beam strikes the sample, and scattered speckle intensity maps (with coordinates defined by the wave-vector q and azimuth angle ) are measured as a function of time. Correlations of the measured speckle intensity are taken to obtain the second-order correlation function as a function of delay time t. (B) USAXS intensities of the arrested gel. The scattering is captured by a hard sphere model (HSM) at high q, a unified model (UM) at intermediate q, and a Porod scattering response at low q. The region of interest probed by XPCS is shown by the shaded region, which is bound by q = 0.0032 Å−1 and 0.063 Å−1 and a noise floor at low . The UM captures the cluster size of the associative gel and shows that the XPCS region of interest is within the primary cluster size. All fitting parameters are listed in SI Appendix, Table S1. (C) The second-order correlation function as a function of delay time for the arrested system in situ gelled in a capillary (see holder configuration in SI Appendix, Fig. S3). The correlation decay is fitted to the Siegert relation in Eq. 2. The -axis is rescaled by with ; data collapse here indicates that superdiffusive dynamics drive both the fitted decay and the long-time tail. The inset shows the original q-dependent data in the range (increasing in q from right to left). (D) Graphs of the q-dependent structure factor , microscopic relaxation time , and compressing exponent . The and values shown are averages taken from 20 independent experiments conducted in the capillary (see statistics for in SI Appendix, Fig. S5). The structure factor is obtained by dividing by the HSM results (Fig. 2B). The dashed line in the plot indicates the noise threshold dictated by low ; measurements made at corresponding to exhibit larger error bars, as shown. The data points in this noise floor are indicated by smaller symbols, and are shaded in gray. The relaxation times above this noise floor, at , are fitted to the relation to obtain .

