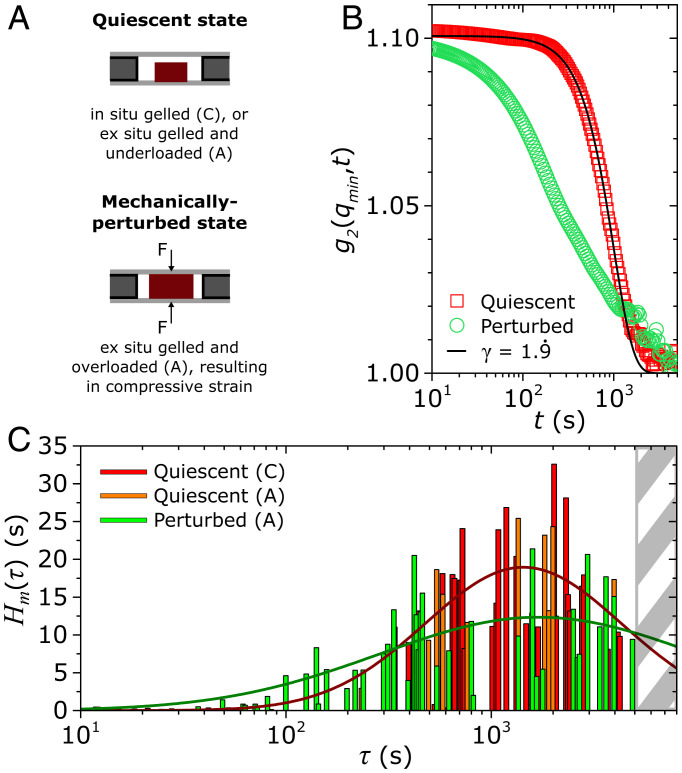
Fig. 4.
Perturbation-induced broadening of the distribution of microscopic relaxation times in the arrested gel. (A) Configurational descriptions of the gel system in the quiescent state and in the mechanically perturbed state. The quiescent state is probed either through in situ gelation of the system in a capillary (denoted C), or through underloading an aluminum cell (denoted A) with an ex situ gelled material. Detailed illustrations of the C and A configurations are in SI Appendix, Fig. S3. We induce mechanical perturbations to our gels by overloading the aluminum cell with the ex situ gelled material, resulting in a compressive strain of ∼10 %. (B) Representative second-order correlations for the quiescent system (in the capillary) and perturbed system. The data shown here are time-wavevector superposed—in similar vein to the data shifting performed in Fig. 2C—such that data collected over the range are shifted to a reference wave vector of , which allows us to sample longer time scales of up to s. The quiescent system in the aluminum cell shows a similar response to the quiescent system in the capillary (SI Appendix, Fig. S7). The quiescent data show good agreement with Eq. 2, with a ballistic decay exponent of . (C) Discrete spectra of ballistic microscopic relaxation times in the quiescent and perturbed systems at and , obtained via the protocol highlighted in Materials and Methods. The analysis is done on 15 experiments in the capillary configuration, 6 experiments in the aluminum configuration at quiescence, and 11 experiments in the aluminum configuration under perturbations. The vertical shading at denotes the time-scale limitations of the experiments. The data for quiescent (capillary and aluminum-cell data combined) and perturbed conditions are fitted to a Gaussian function of the form (red and green lines, respectively). Note the fits are for visual guidance only to highlight the emergence of short-time dynamics in the perturbed system.

