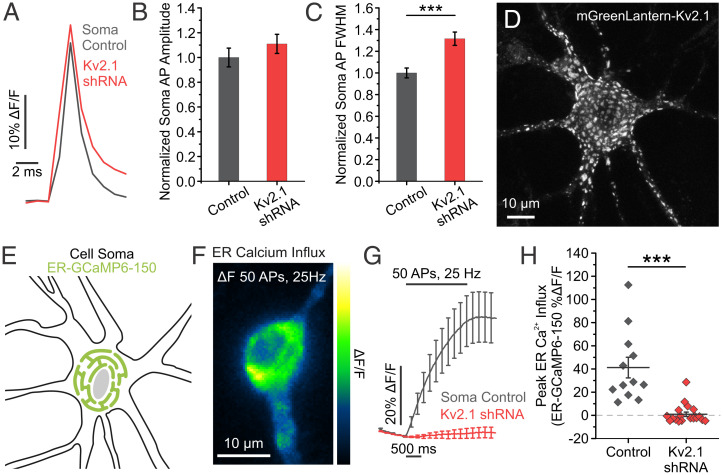
Fig. 1.
Kv2.1 has both ionotropic and nonionotropic functions in the soma. (A) Average traces of somatic QuasAr fluorescence, trial averaged from 50 AP stimulations delivered at 25 Hz. (B and C) Quantification of AP amplitude (B) and FWHM (C) (control neurons, n = 16 cells; Kv2.1 KD neurons, n = 21 cells; ***P < 0.001 for FWHM comparison, Student’s t test). (D) Example image of a cultured hippocampal neuron expressing mGreenLantern-Kv2.1. Note distinct clusters form across the membrane surface. (E) Cartoon of a neuronal soma expressing the fluorescent Ca2+ indicator ER-GCaMP6-150 in the ER lumen. (F) Image of the change in fluorescence of somatic ER-GCaMP6-150 in response to a train of stimulation. (G and H) Average fluorescence traces of somatic ER-GCaMP6-150 (G) and quantification of peak fluorescence (H) for both control and Kv2.1 KD neurons (control neurons, n = 12 cells; Kv2.1 KD neurons, n = 19 cells; ***P < 0.001, Student’s t test).

