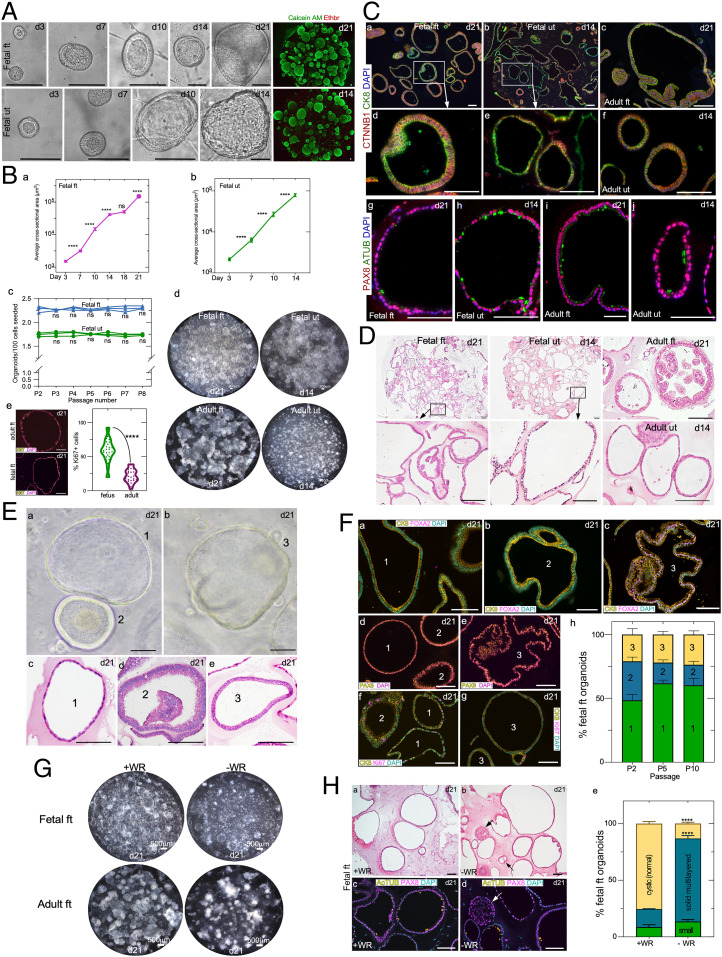
Fig. 3.
Human fetal FT and uterine organoids and their comparison with adult tissue-derived organoids. (A) Timeline depicting organoid development of human fetal FT and uterine epithelial cells. Fluorescent images of fetal organoids after calcein AM (green) and ethidium homodimer 1 (red) cell-viability staining (n = 5). (B, a and b) Quantification of the average fetal FT (B, a) and uterine (B, b) organoid size at various days of culture; n = 3; ****P = <0.0001; ns, not significant; Brown–Forsythe and Welch’s ANOVA with Dunnett’s T3 multiple-comparison test. (B, c) Quantification of the fetal organoid forming efficiency at the indicated passages; n = 3 each; two-way ANOVA with Sidak’s test. (B, d) Whole-well bright-field images of fetal and adult FT and uterine organoids cultured in 24-well plates (n = 3 each). (B, e) Representative fluorescent images and quantification of Ki67+ proliferating cells in adult and fetal FT organoids; n = 3 biological replicates × 10 images per replicate; ****P = <0.0001, unpaired t test with Welch’s correction. (C) Coimmunostaining for β-catenin/CTNNB1 and CK8 (C, a–f) and PAX8 and AcTUB (C, g–j) in fetal FT (C, a, d, and g), fetal uterine (C, b, e, and h), adult FT (C, c and i), and adult uterine (C, f and j) organoids at the indicated days of culture (n = 3 biological replicates per group × 10 tissue sections of 5-μm thickness per replicate). C, d and e represent higher-magnification images of C, a, Inset and C, b, Inset, respectively. (D) Representative histological images of fetal and adult organoids (n = 3 each). (D, Insets) Higher-magnification images. (E) Representative gross (E, a and b) and histological images (E, c–e) of three different types of fetal organoids (n = 3 biological replicates each). (F) Coimmunostaining for CK8 with FOXA2 (F, a–c) and Ki67 (F, f and g) and immunostaining for PAX8 (F, d and e) in the three different types of fetal organoids from E at the indicated days of culture. Type 1 and 2 organoids were PAX8+ and FOXA2−, whereas type 3 organoids were positive for both markers. Quantification of the distribution of these three types of organoids at the indicated passages 2, 5, and 10; n = 3; two-way ANOVA with Tukey’s multiple-comparison test. (G) Representative whole-well images of fetal and adult FT organoids cultured with or without WNT3a and R-Spondin-1 (n = 3 biological replicates per group). (H) Representative histological (H, a and b) and PAX8 and ACTUB–colabeled fluorescent (H, c and d) images of fetal FT organoids from G. Arrows in H, b and d denote small multilayered organoids present in Wnt-deficient (−WR) culture conditions. (H, e) Quantification of the distribution of different fetal FT organoid type cultures in high Wnt (+WR) and low Wnt (−WR) conditions; n = 3 biological replicates per group; ****P = <0.0001, two-way ANOVA with Tukey’s multiple-comparison test. Data represent means ± SEM. (Scale bars, 100 μm unless indicated otherwise.)

