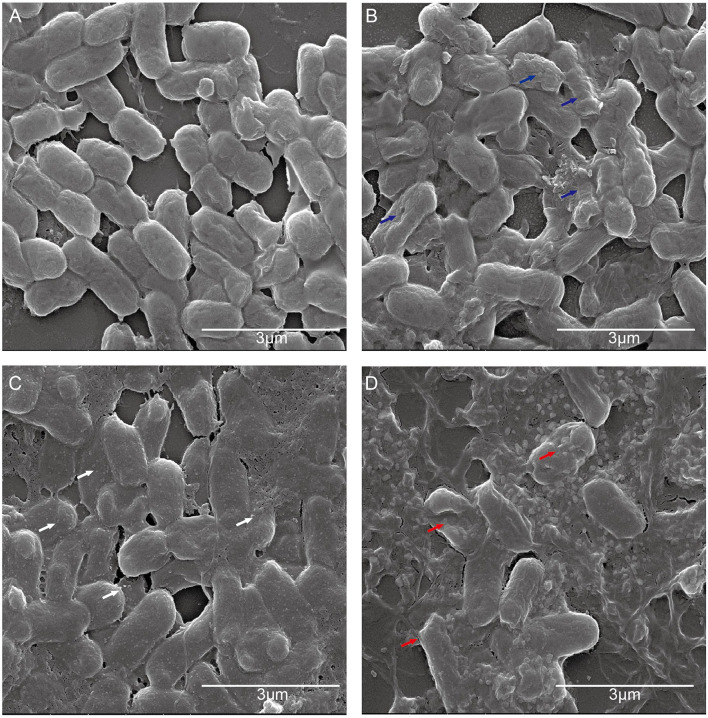
Figure 4.
The effect of CATH-1 and erythromycin combination on E. coli morphology. E. coli cells were grown to the mid-logarithmic phase and then treated with CATH-1 and erythromycin. After treatment, SEM was performed to observe bacterial morphology. (A) Untreated E. coli. (B) 1/16 MBC CATH-1-treated E. coli. (C) 1/16 MBC erythromycin-treated E. coli. (D) 1/16 MBC CATH-1 + 1/16 MBC erythromycin-treated E. coli. Blue arrows represent rough cell membrane, white arrows represent micelles, and red arrows represent cell lysis.

