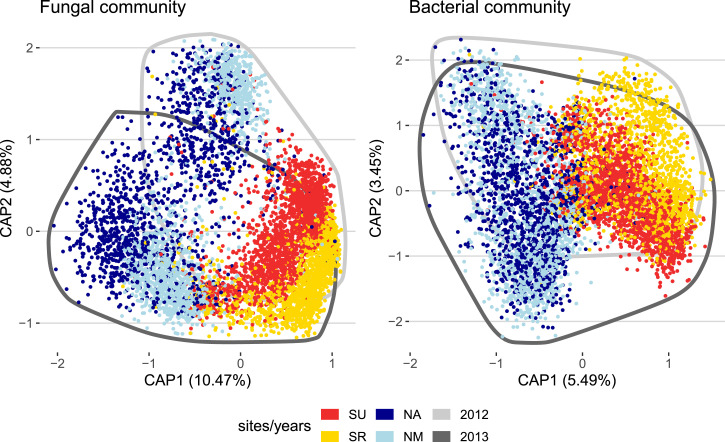
Fig. 1.
Plants grown in different environments have different microbial communities. The plots represent the projection of each sample on the plane defined by the first two constrained components of the fungal and bacterial communities, describing variation among sites and years. The percentages in parentheses are the proportion of the total inertia (square root of the Bray–Curtis dissimilarity) explained by each component. The colors of the points indicate the site from which samples were collected. Experiments from the south are represented in red (SU) and yellow (SR), and experiments from the north are represented in blue (NR) and dark blue (NA). All points from 2012 and 2013 are encircled by a darker and lighter gray line, respectively.

