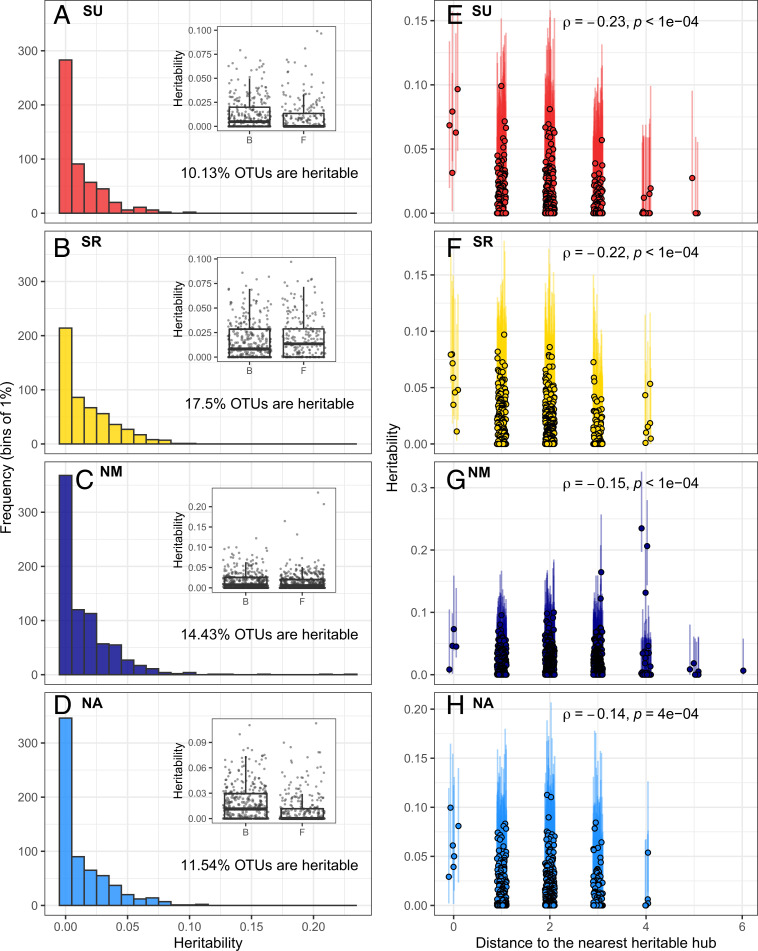
Fig. 2.
The effect of host genetic variation on the microbial community targets relatively few OTUs and percolates across the network. This figure corresponds to observations in the set of four experiments performed in 2013. The same figure is available for the 2012 experiments in SI Appendix, Fig. S3. (A–D) Each frame presents the distribution of heritability estimates for individual OTUs in one site. In each frame, Inset graph is a box and whiskers plot contrasting the heritability (y axis) of bacterial (B) and fungal (F) OTUs. (E–H) The heritable hubs are represented at a distance of zero (hub). The other points are OTUs connected to heritable hubs, directly (distance = 1) or indirectly (distance > 1). The x axis represents the number of edges in the network separating an OTU and its nearest heritable hub. The correlation coefficients presented are Spearman rank correlations between heritability and distances to the heritable hub(s) (including zero).

