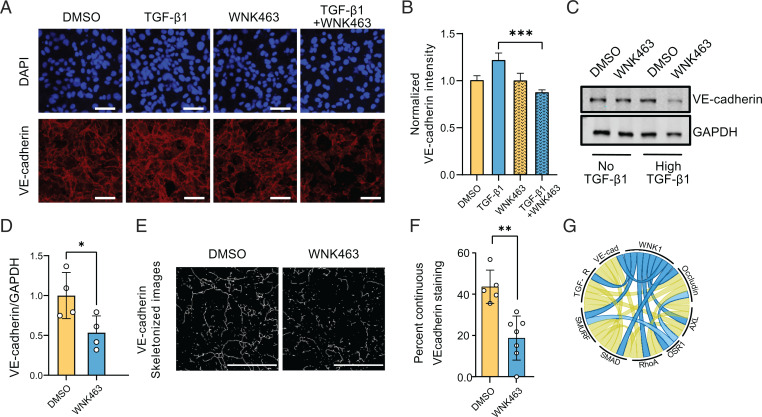
Fig. 6.
WNK1 influences VE-cadherin expression in a TGF-β–dependent manner. (A) Representative confocal images of immuno-fluorescently labeled endogenous VE-cadherin (red) nucleus (DAPI: blue) in HDMECs with or without TGF-β1 (10 ng/mL) and/or WNK463 (1 µM) treatment. Scale bar, 60 µm. (B) Corresponding quantification shows decreased normalized fluorescence intensity of VE-cadherin in TGF-β1+WNK463 compared with TGF-β1 alone. DMSO: n = 21; WNK463: n = 23; TGF-β1: n = 8; and TGF-β1+WNK463: n = 55. (C) Representative Western blots show VE-cadherin expression upon overnight TGF-β1 (10 ng/mL) and/or WNK463 (1 µM) treatment in HUVECs. (D) Corresponding quantification of images in C shows decreased VE-cadherin expression in TGF-β1+WNK463 compared with TGF-β1 alone; n = 4. (E) Representative images showing “line structures” on VE-cadherin staining obtained from confocal images of HDMECs treated with DMSO or WNK463 (1 µM), both in the presence of TGF-β1 (10 ng/mL) using the MorphologicalSkeleton module. Scale bar, 35 µm. (F) Quantification of continuous VE-cadherin–staining pattern expressed as percentage of total VE-cadherin staining in HDMECs treated with DMSO or WNK463 (1 µM), both in the presence of TGF-β1 (10 ng/mL). Control: n = 5; WNK463: n = 7. (G) Chord diagram (80) depicting collaborative network among WNK1, OSR1, and TGF-β signaling mediators. Data are represented as mean ± SE analyzed by unpaired two-tailed Student’s t test or one-way ANOVA. *P < 0.05, **P < 0.005, ***P < 0.0005.

